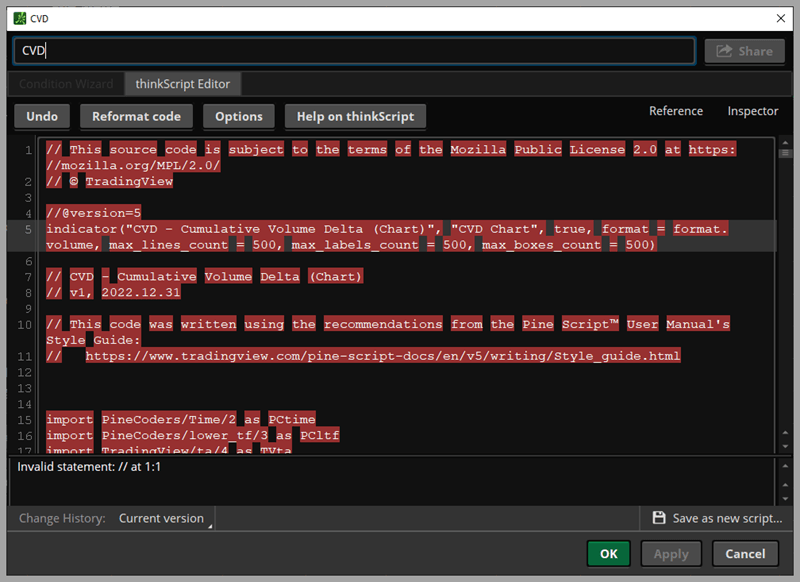
So you found an interesting indicator on TradingView that you want to use for ThinkorSwim, but upon importing the code into your TOS setup, it doesn’t work.
The code failed to function, and ThinkorSwim is highlighting everything in red with an error message that says “Invalid statement.”
That’s a problem that many ThinkorSwim users are going through right now.
Why TradingView Script Don’t Work in ThinkorSwim
Here’s why the TradingView script you added to ThinkorSwim doesn’t work.
TradingView utilizes Pine Script as its coding language for indicators, while ThinkorSwim uses thinkScript.
Therefore, a proper conversion is required to integrate a TradingView indicator into ThinkorSwim.
In this tutorial, I’ll briefly demonstrate how to accomplish this task. Please note that this is not a comprehensive guide but rather an introduction. If you require further assistance, my Pine Script to thinkScript service is available.
How to Convert from TradingView PineScript to ThinkorSwim thinkScript
Although Pine Script and thinkScript are different programming languages, they share many similar functions and inputs.
If you have prior experience in either language, the conversion process from Pine Script to thinkScript should be relatively straightforward.
Convert Script Inputs
The input function in Pine Script (TradingView) and thinkScript (ThinkorSwim) allows users to adjust a specific value or setting utilized by the indicator in its calculation.
Here’s an example snippet from a TradingView indicator:
//inputs
showMA = input(true, "Show Moving Average")
ilength = input.int(50, "MA Length", minval = 1, maxval = 500, step = 1)
idownday = input(color.red, "Down Day Color", inline = "a")
idday = input(color.maroon, "Distribution Color", inline = "a")
iupday = input(color.green, "Up Day Color", inline = "b")
iaday = input(color.lime, "Acumulation Day Color", inline= "b")
The equivalent of input.int in thinkScript is simply just input().
# inputs
input showMA = yes;
input ilength = 50;
In the conversion process, PineScript’s “True” and “False” become “Yes” and “No” in thinkScript.
I disregarded color inputs as they are not supported by thinkScript, but we can easily assign custom colors later.
Convert Functions and Plots
Moving on to converting the functions and plots.
//define days
down_day = close[1] > close
up_day = close[1] < close
avg_vol = ta.sma(volume,ilength)
d_day = down_day and volume > avg_vol
a_day = up_day and volume > avg_vol

//select colors
palette = down_day ? idownday : iupday

if d_day
    palette := idday
if a_day
    palette := iaday

//plot it
plot(volume, color = color.new(palette,0), style=plot.style_columns, title="Volume")
plot(showMA ? ta.sma(volume,ilength) : na, color=color.new(color.orange,0), title="Volume MA")
Now let’s convert all of that to ThinkorSwim
## define days
def down_day = close[1] > close ;
def up_day = close[1] < close;
def avg_vol = Average(volume,ilength);
def d_day = down_day and volume > avg_vol;
def a_day = up_day and volume > avg_vol;

## plot it
plot data = volume;
plot movingMa = if showMA then avg_vol else double.nan;

#custom colors
data.AssignValueColor(if d_day then color.dark_red else if a_day then color.light_green else if down_day then color.red else color.green);
data.SetPaintingStrategy(PaintingStrategy.HISTOGRAM);
Final Result
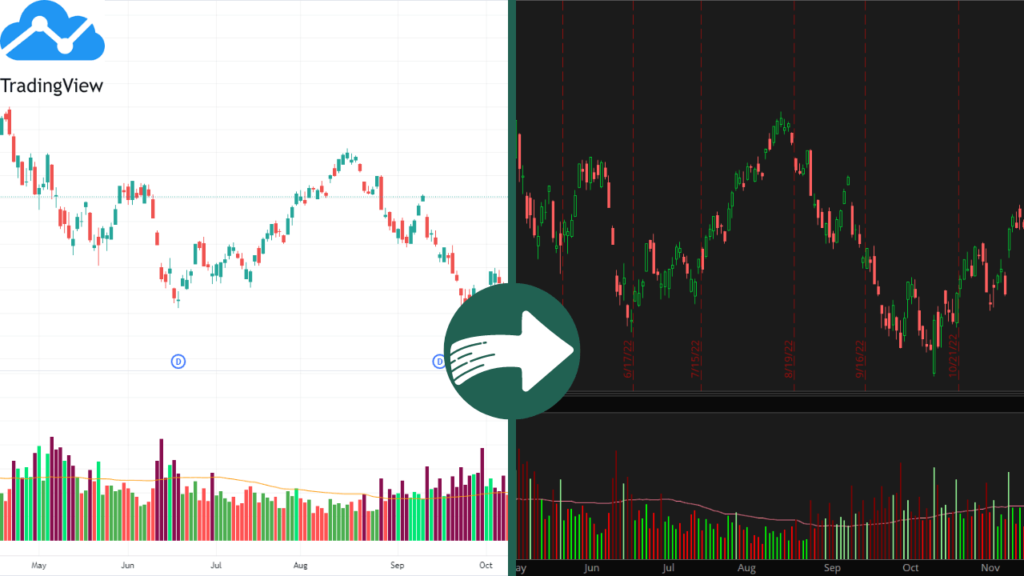
Below you will find a side-by-side comparison of the two scripts. In it, I highlighted what I’ve changed to make the TradingView indicator work in ThinkorSwim.
TradingView Version
// This source code is subject to the terms of the Mozilla Public License 2.0 at https://mozilla.org/MPL/2.0/
// © Amphibiantrading

//@version=5
indicator(title="Volume With Color", shorttitle="Vol W/ Color", format=format.volume)

//inputs
showMA = input(true, "Show Moving Average")
ilength = input.int(50, "MA Length", minval = 1, maxval = 500, step = 1)
idownday = input(color.red, "Down Day Color", inline = "a")
idday = input(color.maroon, "Distribution Color", inline = "a")
iupday = input(color.green, "Up Day Color", inline = "b")
iaday = input(color.lime, "Acumulation Day Color", inline= "b")

//define days
down_day = close[1] > close
up_day = close[1] < close
avg_vol = ta.sma(volume,ilength)
d_day = down_day and volume > avg_vol
a_day = up_day and volume > avg_vol

//select colors
palette = down_day ? idownday : iupday

if d_day
    palette := idday
if a_day
    palette := iaday

//plot it
plot(volume, color = color.new(palette,0), style=plot.style_columns, title="Volume")
plot(showMA ? ta.sma(volume,ilength) : na, color=color.new(color.orange,0), title="Volume MA")
ThinkorSwim Version
declare lower;

# inputs
input showMA = yes;
input ilength = 50;

## define days
def down_day = close[1] > close ;
def up_day = close[1] < close;
def avg_vol = SimpleMovingAvg(volume,ilength);
def d_day = down_day and volume > avg_vol;
def a_day = up_day and volume > avg_vol;

## plot it
plot data = volume;
plot movingMa = if showMA then avg_vol else double.nan;

#custom colors
data.AssignValueColor(if d_day then color.dark_red else if a_day then color.light_green else if down_day then color.red else color.green);
data.SetPaintingStrategy(PaintingStrategy.HISTOGRAM);
Notes:
- The function
ta.smais replaced withAverage()orSimpleMovingAvg() - When defining variables in thinkScript, you have to use “def.”
- When rendering the data on your ThinkorSwim chart, you use “plot.”
- The Histogram painting style is used in the ThinkorSwim version to match the column style used by the TradingView script.
Additionally, you must add a declaration (declare lower) at the top of the script if the indicator is placed at the lower subgraph of the chart.
For reference, here is the TradingView script I used for the example above.
Converting TradingView indicators to ThinkorSwim involves reorganizing the code and finding equivalent functions.
Complex indicators may require extra effort to convert. If you’d like to skip the hassle, check out my Pine Script to thinkScript service below.
Pine Script to thinkScript Converter
This is a done-for-you service where I take your request and convert the entire TradingView indicator into a ThinkorSwim indicator.
Upon completion, you’ll receive a fully working ThinkorSwim version. All you have to do is import the code into your ThinkorSwim platform and enjoy.
How much does it cost?
It depends on the complexity of your requested script. A quote will be provided to you.
Can you show me some samples?
I have converted hundreds of TradingView scripts to ThinkorSwim. Most are delivered privately to clients. There are a few published on this site for free.
Has anyone tried to code the Normalized MACD indicator in TradingView in TOS? I’m struggling trying to. Thank you.
I am not familiar with the TradingView version but I just threw this together to normalize MACD. If the look needs to be different to match TradingView let me know.
declare lower; input NormalizedRange = 100; script normalizePlot { input data = close; input Range = 1; def hhData = HighestAll( data ); def llData = LowestAll( data ); plot nr = ((( Range - -Range ) * ( data - llData )) / ( hhData - llData )) + -Range; } input fastLength = 12; input slowLength = 26; input MACDLength = 9; input averageType = AverageType.EXPONENTIAL; input showBreakoutSignals = no; def Value = MovingAverage(averageType, close, fastLength) - MovingAverage(averageType, close, slowLength); plot ZeroLine = 0; plot NormalizedValue = normalizePlot(Value, NormalizedRange); plot Avg = MovingAverage(averageType, NormalizedValue, MACDLength); plot Diff = NormalizedValue - Avg; plot UpSignal = if Diff crosses above ZeroLine then ZeroLine else Double.NaN; plot DownSignal = if Diff crosses below ZeroLine then ZeroLine else Double.NaN; UpSignal.SetHiding(!showBreakoutSignals); DownSignal.SetHiding(!showBreakoutSignals); NormalizedValue.SetDefaultColor(GetColor(1)); Avg.SetDefaultColor(GetColor(8)); Diff.SetDefaultColor(GetColor(5)); Diff.SetPaintingStrategy(PaintingStrategy.HISTOGRAM); Diff.SetLineWeight(3); Diff.DefineColor("Positive and Up", Color.GREEN); Diff.DefineColor("Positive and Down", Color.DARK_GREEN); Diff.DefineColor("Negative and Down", Color.RED); Diff.DefineColor("Negative and Up", Color.DARK_RED); Diff.AssignValueColor(if Diff >= 0 then if Diff > Diff[1] then Diff.color("Positive and Up") else Diff.color("Positive and Down") else if Diff < Diff[1] then Diff.color("Negative and Down") else Diff.color("Negative and Up")); ZeroLine.SetDefaultColor(GetColor(0)); UpSignal.SetDefaultColor(Color.UPTICK); UpSignal.SetPaintingStrategy(PaintingStrategy.ARROW_UP); DownSignal.SetDefaultColor(Color.DOWNTICK); DownSignal.SetPaintingStrategy(PaintingStrategy.ARROW_DOWN);I have a tradingview indicator, about 30 lines of pinescript.
I would like to convert it to Think or Swim study.
What do you need in order to give me a quotation ?
Fill this out form https://airtable.com/shrPCFsvM979cXJb2
The code is a customized Cumulative Volume Delta indicator. This indicator can be googled, but I need my custom version converted. It is about 30 lines of pinescript. I copied/pasted it to the form and submitted. If you have any problem receiving it, let me know and I’ll upload to dropbox and pass you the url.
I’m getting an error from assignvaluecolor line 34 on down.
hello, I have 2 scripts for ORB. One script will plot the time values for the current and historic sessions. But the the H/L for the plot is in a staggered or stair-stepped look. Conversely, the other script plots only the current session for the time brackets, but the plot is a nice horizontal line at the H/L or the range. I don’t code, but I have looked at both scripts and the plot syntax are nearly the same. So it would seem to me, to be easier to change how (1) plots the out to have the nice horizontal H/L. What is the secret?
Oh, I should have said this is a TOS script.. I wish I could have inserted a picture to illustrate the differences.
How do I send a link to a script? Meaning, how do I create a link to a script vs copying/pasting the actual script? Thanks.