thinkScript color variables are an important part of creating custom studies. The colors associated with output functions can add visual appeal to your indicator.
Furthermore, they can also aid in highlighting crucial components of a study or strategy.
When creating custom indicators for ThinkorSwim, you can add color to output, like plots, labels, candlesticks, and even the background of your chart.
In today’s guide, we will be going over the standard thinkScript colors. Later in the post, you will learn how to apply custom RGB color codes to your script.
Standard thinkScript Colors
Out of the box, thinkScript support the following set of constants for colors.
- BLACK
- BLUE
- CURRENT
- CYAN
- DARK_GRAY
- DARK_GREEN
- DARK_ORANGE
- DARK_RED
- DOWNTICK
- GRAY
- GREEN
- LIGHT_GRAY
- LIGHT_GREEN
- LIGHT_ORANGE
- LIGHT_RED
- LIME
- MAGENTA
- ORANGE
- PINK
- PLUM
- RED
- UPTICK
- VIOLET
- WHITE
- YELLOW
These colors are popular among thinkScript developers because they are easy to implement.
Here’s an example:
input price = close;
input length = 9;
plot SMA = Average(price, length);
SMA.SetDefaultColor(Color.Yellow);
In the example above, I was able to easily set the color yellow to my simple moving average line by using the SetDefaultColor() function with the Color.Yellow variable.
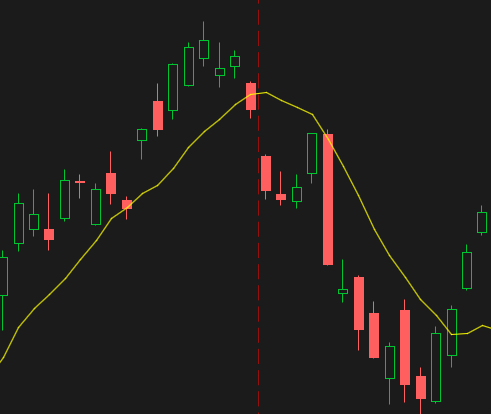
If you prefer a different color, remove “Yellow” and replace it with any of the colors from the list above.
The script below plots the highest high and lowest low of the last 10 bars. We assign the color red to the upper trend line and the color green to the lower trend line.
input length = 10;
plot upper_line = highest(high, length);
plot lower_line = lowest(low, length);
upper_line.SetDefaultColor(Color.Red);
lower_line.SetDefaultColor(Color.Green);
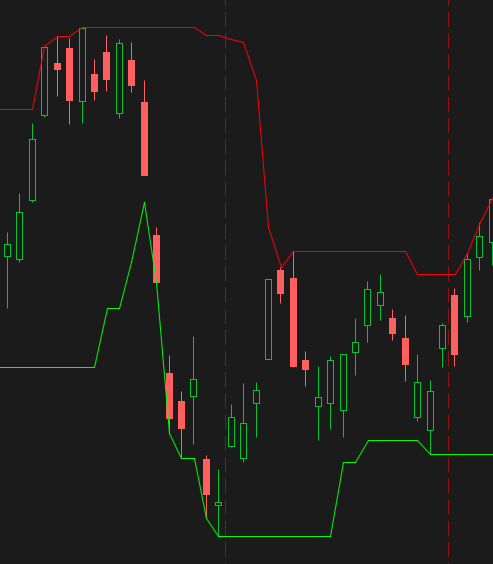
Fairly simple, right? The SetDefaultColor() function is very useful in this aspect. It helps to define the color variable for your plot.
thinkScript RGB Colors
One thing I really like about thinkScript is that you are not constrained to the default colors. ThinkorSwim allows you to use custom RGB colors in your script.
To produce a color based on its RGB code, we use the CreateColor() function.
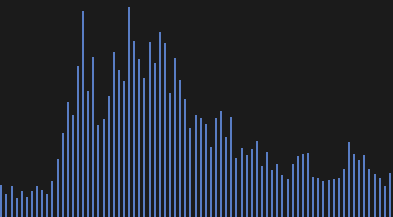
declare lower;
plot Vol = volume;
Vol.SetPaintingStrategy(PaintingStrategy.HISTOGRAM);
Vol.SetDefaultColor(CreateColor(89,125,196));
The volume in ThinkorSwim is usually shown as green and red bars. But that shouldn’t be the case with the script above. I’ve changed the color of the volume bars to a different color (RGB code: 89,125,196).
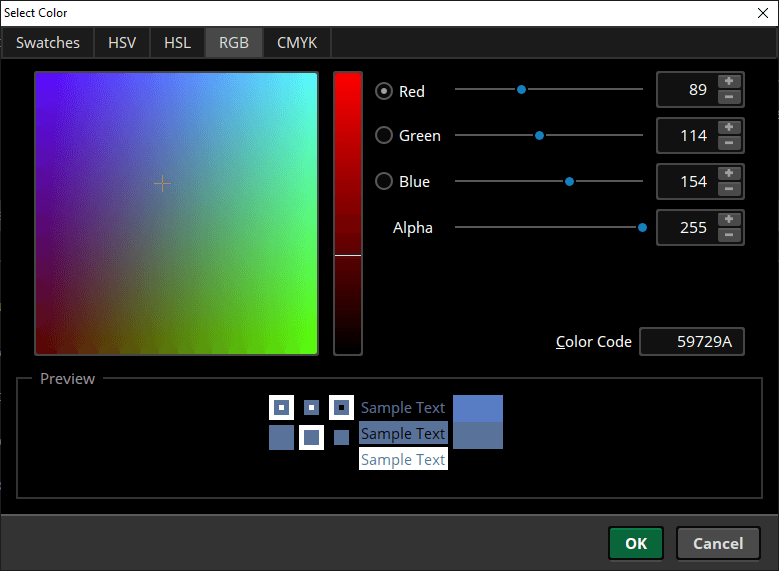
Advanced Color Editor in thinkScript
The Advanced Color Editor is a tool that can be used to change the color of an indicator without coding.
It can be accessed by clicking the Color Palette icon in the indicator settings window.
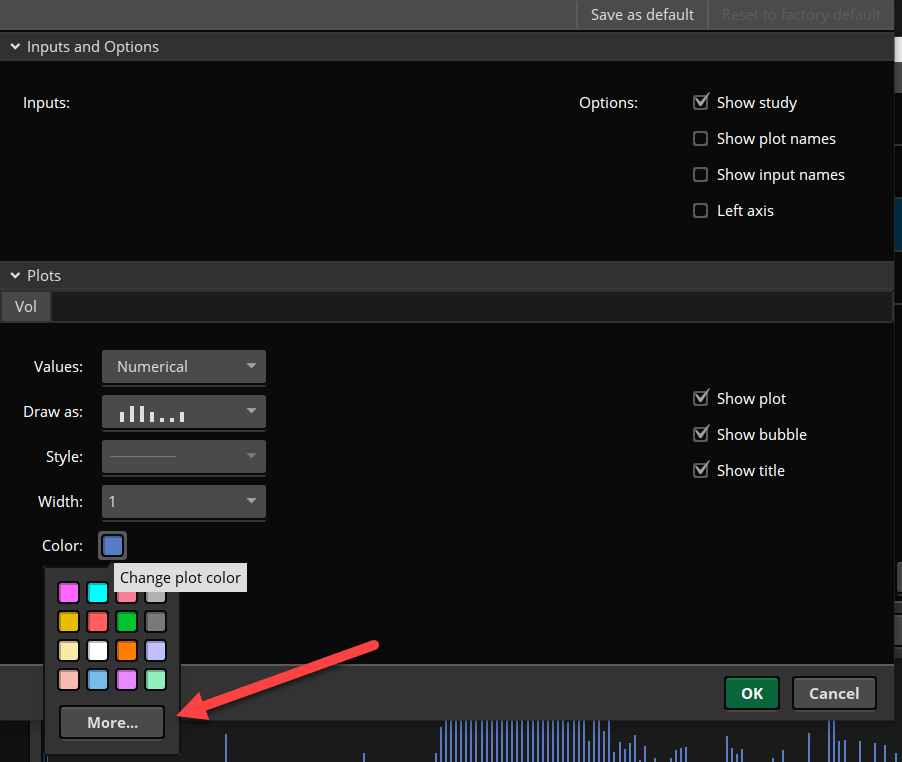
The Advanced Color Editor in ThinkorSwim has various options for changing an indicator’s color.
Particularly noteworthy are the RGB sliders, which let you adjust the RGB values by dragging the sliders from left to right.
You can also type in specific RGB values if you prefer to use an exact shade.
Final Words
There are 25 standard colors in thinkScript, including cyan, magenta, yellow, green, and red.
They are easy to implement using the SetDefaultColor() function and each color begins its name with Color.. All you have to do is fill in the blank with the color of your choice.
If you’re feeling adventurous, you can create a custom color for your plot and use its RGB code in your indicator.
Happy testing!