There are multiple ways to show your entry price on a ThinkorSwim chart.
You can display it as a line on the chart to show the average price at which you entered your long or short position.
In addition, a sidebar widget is available to help you track multiple positions at the same time.
Method #1: Use GetAveragePrice() Function
The GetAveragePrice() function in thinkScript returns the average trade price for a specified instrument.
ThinkorSwim computes all your entry prices automatically and displays the average on the chart.
def averagePrice = GetAveragePrice();
plot AverageCostBasis = If(averagePrice > 0, averagePrice, double.NaN);
Here’s an example:
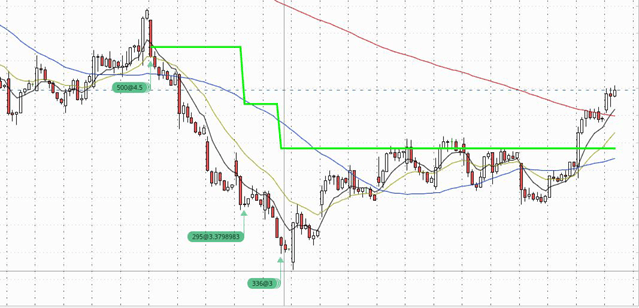
Alternatively, you can use the indicator below to plot the average entry price from the last entry bar.
# Acutal Trade Price
# Mobius
# V01
input ShowEntry = yes;
def Entry = if IsNaN(GetAveragePrice())
then Entry[1]
else GetAveragePrice();
def LastEntryBar = if Entry != Entry[1]
then BarNumber()
else LastEntryBar[1];
plot Entry_ = if BarNumber() >= HighestAll(LastEntryBar) and Entry > 0 and ShowEntry
then HighestAll(if IsNaN(close[-1])
then Entry
else Double.NaN)
else Double.NaN;
Entry_.SetStyle(Curve.LONG_DASH);
Entry_.SetLineWeight(3);
Entry_.SetDefaultColor(CreateColor(255, 215, 0));
Entry_.HideBubble();
Entry_.HideTitle();
AddChartBubble(BarNumber() == HighestAll(BarNumber()), Entry_, AsDollars(Entry), Entry_.TakeValueColor());
# End Code
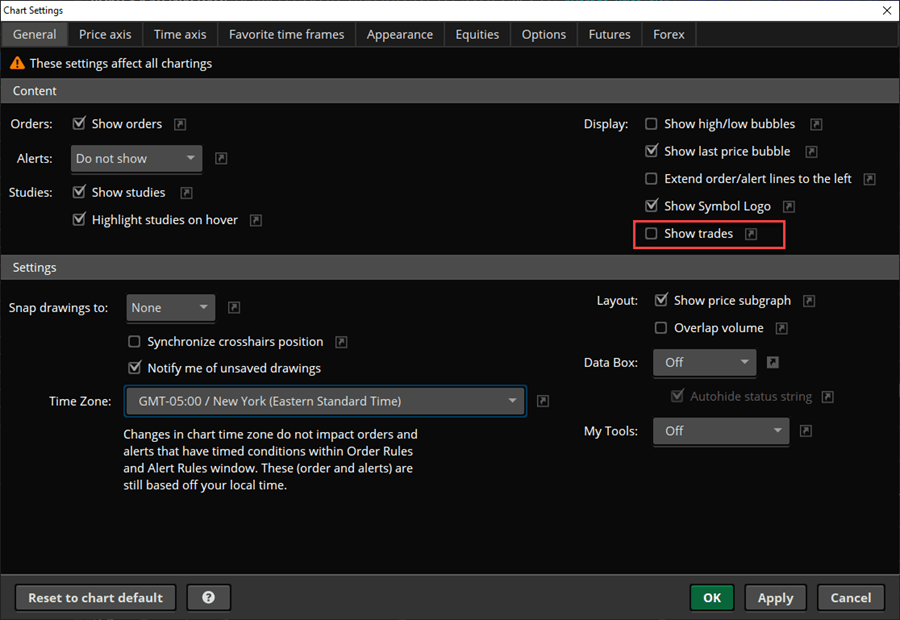
Method #2: Enable Show Trades
In your chart settings, there’s an option called Show trades. Select the checkbox and click Apply.
This setting will display your trade order history on the charts.
Method #3: Current account positions widget
In ThinkorSwim, add a new Watchlist widget on the left sidebar.
Click on the menu dropdown and select Current account positions.
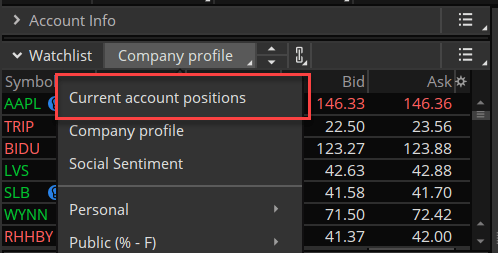
This watchlist can display the average price for multiple positions/trades.
Final Words
Having your positions and the average entry price displayed in ThinkorSwim make trade management easier.
Luckily, with ThinkorSwim’s built-in features and a custom indicator, the task is easily achievable.
You can track your positions in ThinkorSwim by showing the average price on your chart and following all your current positions via a Watchlist gadget.
This is not working for me for some reason. Any setting options that need to be enabled?
Which method from the tutorial did you follow?
Great post!
Method #2 doesn’t work for me. Is it limited to certain timeframes?
Method #2 only shows your actual trades. No position average line appears.
I tried Method #2 also and no trades or positions are showing up on my chart. My chart is a 5 minute chart, no studies on the chart (e.g. Bollinger bands or MAs) . 2 lower studies (MACD and Money FLow Index). I doubled checked my chart settings and “Show Trades” is checked. Any ideas? Thanks
Hi Melvin. I’m attempting to use your script from “method 1”. I see the study’s name on the top bar after loading the study, but I don’t see any additional lines or graphics in the chart. Does this still work for you? Are there any style settings I need to change in order for the script to draw?