The AddLabel() function in thinkScript lets you place a personalized label with custom text in the top left-hand corner of your chart.
There is no need to get the coordinates of your chart or find the specific position. Once the output is there, your labels automatically get drawn to the top-left graph corner.
In this post, I’ll provide some basic examples of the AddLabel function in thinkScript.
How to Add Label to ThinkorSwim Chart
To add a custom label with text to your ThinkorSwim chart, we use the AddLabel function.
It looks something like this:
AddLabel(yes, "Hello Chart");
The default color of the label is red. If you want to use a different color, you will need to specify it in the code.
AddLabel(yes, "Hello Chart", color.green);
Now the label is green instead of red.

Fixed Value Label in thinkScript
The AddLabel() function is very flexible. It can handle both fixed and dynamic values.
A fixed AddLabel function is where we establish the text without defining a condition or parameter.
For example:
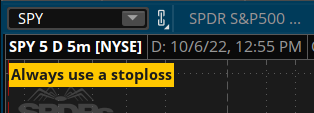
AddLabel(yes, "Always use a stoploss", color.orange);
In the example above, the text “Always use a stoploss” is a fixed value. As a result, the label will always display that no matter what happens.
Dynamic Label in thinkScript
A dynamic AddLabel function in thinkScript will move and adjust on its own based on a defined condition.
Apply “if this then that” in AddLabel()
AddLabel(yes, if close > open then "Gren Bar" else "Red Bar");
For this example, we want the label to display the status of the current candle.
If it’s a green bar, the label will say “Green Bar.” Otherwise, it will display “Red Bar.”
Display stock price as label
That wasn’t dynamic enough? How about we create a label where the value is constantly changing?
Sure, we can do that. Let’s add a label where it shows the current stock price.
AddLabel(yes, "Current stock price: " + close, color.yellow);

AddLabel in Custom Quotes
ThinkorSwim custom watchlist column also supports the AddLabel function. However, it works a bit differently.
The label no longer has a background color. When we assign a color to the label, it changes the color of the text instead.
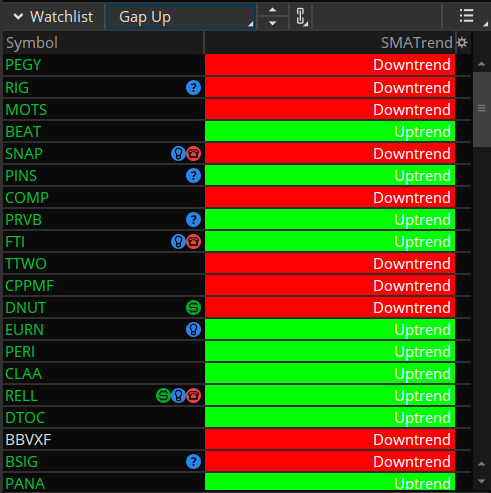
AddLabel(yes, if close > Average(close, 200) then "Uptrend" else "Downtrend", color.green);
To fix this problem, we use the AssignBackgroundColor() function.
If the stock is above the 200-period simple moving average, it will have a label that says “Uptrend” with a green background.
If the stock is below the 200-period SMA, it will state “Downtrend,” accompanied by a red background.
AddLabel(yes, if close > Average(close, 200) then "Uptrend" else "Downtrend", color.white);
AssignBackgroundColor(if close > Average(close, 200) then color.green else if close < Average(close,200) then color.red else color.light_gray);
That should beautify the label in your watchlist.
Summary
ThinkorSwim indicators draw labels on the chart with the AddLabel() function.
You can customize the label on your chart by changing its background color.
thinkScript AddLabel function supports both fixed and dynamic values.
I followed the steps to add a label for the rsi but the color function its giving an error message saying an ‘else’ block expected.
My line reads like this …
AddLabel(yes, “RSI = ” + price, if price 50 then color.grey);
Where did I go wrong? Can you fix?
Thinkscript -requires- an else with all if statements.
E..g.: AddLabel(yes, “RSI = ” + price, if price 50 then color.grey else color.white);