In thinkScript, the BarNumber() function retrieves the current bar number.
BarNumber Code Examples
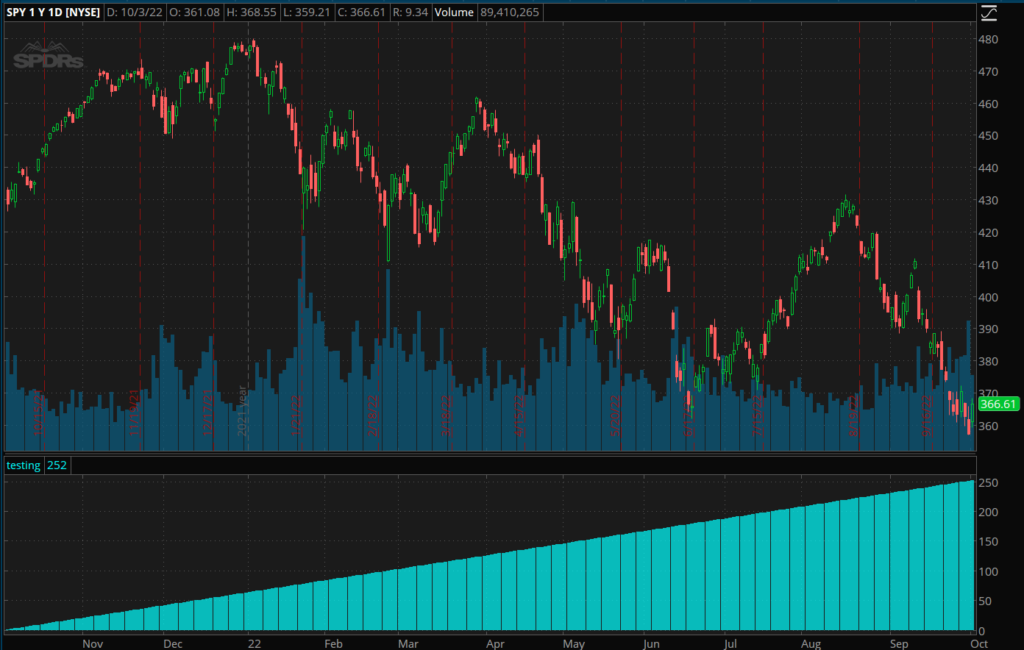
1. List of bars.
declare lower;
Plot Data = BarNumber();
Data.SetPaintingStrategy(PaintingStrategy.HISTOGRAM);
The chart below has 252 bars. This code will start the count from the first bar to the last bar.
Side note: I utilized SetPaintingStrategy to change the default style from a line to a histogram.
2. Plot the bar number of each candlestick.
#hint:Used for debugging code. Plots the BarNumber for every bar
#Version 5/18/12
# Available at http://pastebin.com/y9x59R4J
# Title = BarNumberPlot
# Retrieved from the thinkScript Community OneNote on 10/03/2022.

plot Data = high;
def barNumber = barNumber();
#def barCount = HighestAll(if(IsNaN(price), 0, barNumber));
plot bn = barNumber;
bn.SetPaintingStrategy(PaintingStrategy.VALUES_BELOW);
#####################
Def TotalBars = HighestAll(barNumber());
AddLabel( yes, concat( TotalBars, " Total bars"), Color.white);
################################

AddLabel( yes, concat( TotalBars - 21, " = 21 bars in"), Color.white);
AddLabel( yes, concat( TotalBars - 42, " = 42 bars in"), Color.white);
AddLabel( yes, concat( TotalBars - 63, " = 63 bars in"), Color.white);
AddLabel( yes, concat( TotalBars - 84, " = 84 bars in"), Color.white);
AddLabel( yes, concat( TotalBars - 105, " = 105 bars in"), Color.white);
########### Plot arrows if desired ###################
def arrow21True = if( TotalBars - 21 == barnumber(),1,0);
#plot Arrow21 = if arrow21True then bn[21] else double.nan;
#Arrow21.SetPaintingStrategy(PaintingStrategy.BOOLEAN_ARROW_UP)#;
#Arrow21.SetDefaultColor(Color.YELLOW);
#Arrow21.SetLineWeight(2);

def arrow42True = if( TotalBars - 42 == barnumber(),1,0);
#plot Arrow42 = if arrow42True then bn[42] else double.nan;
#Arrow42.SetPaintingStrategy(PaintingStrategy.BOOLEAN_ARROW_UP);
#Arrow42.SetDefaultColor(Color.YELLOW);
#Arrow42.SetLineWeight(2);
########### EOC ##################
3. If bar number is less than 100 then plot 0 otherwise plot 1.
declare lower;
plot Data = if BarNumber() <= 100 then 0 else 1;
To make it easier to understand, we will combine example 2 and example 3 together.
On the upper chart, we plot the BarNumber for each bar. The value is displayed at the bottom of each candle.
For the lower study (testing2), if the bar number is less than or equal to 100, its value is 0, and for everything else, its value is 1.

3. Count bar number from right to left.
By default, thinkScript counts the bar number from left to right.
JQ from the thinkScript OneNote Community was clever enough to produce a script that does the opposite.
## OneNote Archive Name: BarNumbersBackward_JQ
## Archive Section:  Education
## Suggested Tos Name: BarNumbersBackward_JQ
## Archive Date: 10.5.2018
## Archive Notes: Logic and structure lifted from a Nube script titled Bubble Study Aid

## "##" indicates an addition or adjustment by the OneNote Archivist
# inputs
# universals
def c = close;
def l = low;
def na = Double.NaN;
def bn = BarNumber();
# variables
def currentBar = HighestAll ( if   !IsNaN(c) then bn else na );

plot pastIndex = currentBar - bn;
pastIndex.SetPaintingStrategy(PaintingStrategy.VALUES_BELOW);
pastIndex.SetDefaultColor(CreateColor(225,225,125));
Happy testing!