The plot() function in thinkScript is the most repeatedly used function to render and display data on your chart.
In fact, the template that you start with when creating a new custom ThinkorSwim indicator begins with plot Data = close;
That shows how important the plot() function is in thinkScript.
In today’s guide, I will explain how the plot function works and share a few coding examples with you.
thinkScript Plot()
When you want to output data from your indicator or backtesting strategy, you employ the plot() function.
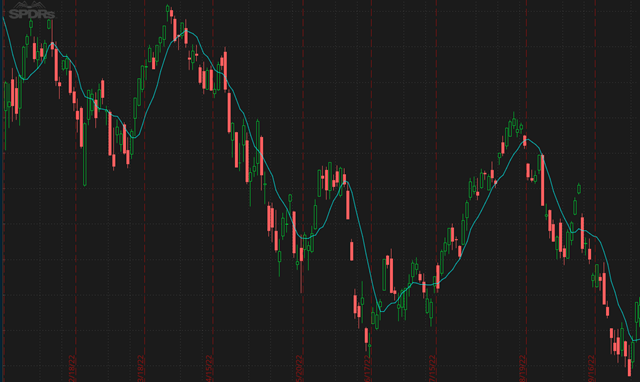
Exampl #1: Plot a simple moving average
input price = close;
input length = 9;
plot SMA = Average(price, length);
This script simply plots a 9-period simple moving average on your chart.
Example #2: Plot implied volatility
declare lower;
plot ImpVol = IMP_VOLATILITY();
If you want to show the implied volatility of the stock, you can start with plot and insert the IMP_VOLATILITY() function.
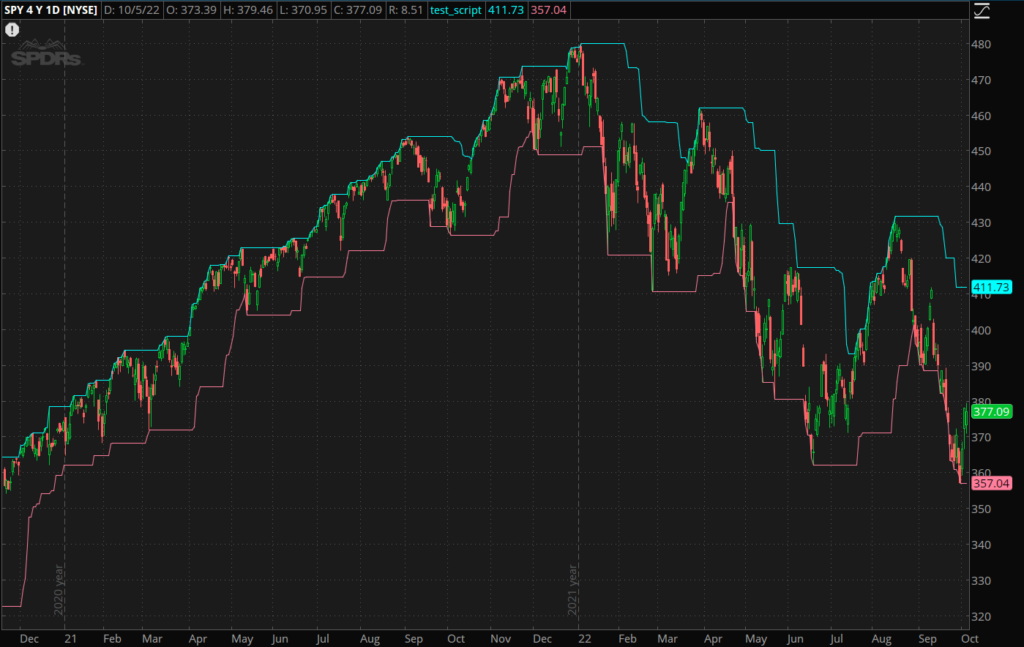
Example #3: Plot highest high and lowest low
plot highestHigh = highest(high, 22);
plot lowestLow = lowest(low, 22);
The code above plots the highest highs and lowest lows of the last 22 candles.
It’s really that easy! You only need two main components.
Start by writing the required series argument and then use the plot() function to render the specified data on the chart.
Customizing your plot
Sometimes, you may not like how thinkScript presents the data on your chart. Certain values require a different set of styles.
By default, the plot function is always displayed as a regular line.
In order to change the style of your plot, you will need to use the SetPaintingStrategy constant.
Histogram plot
Indicators like volume, which shows the distribution of values, might be better suited to be shown as a histogram rather than a line.
Without changing anything from your plot function, you can utilize the SetPaintingStrategy constant to change the style from a line to a histogram.
declare lower;
plot Vol = volume;
Vol.SetPaintingStrategy(PaintingStrategy.HISTOGRAM);
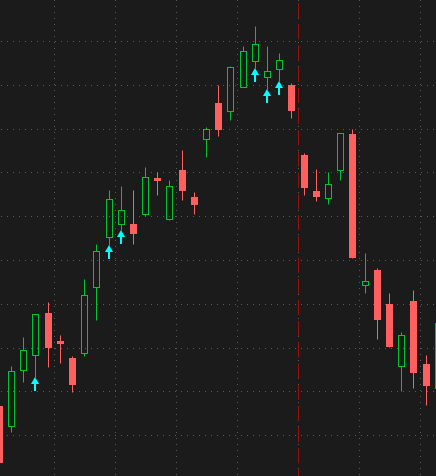
Arrows plot
In some indicators, you will need to use a particular plotting style.
In the following script, I plot arrows on my chart to quickly identify when a 3-consecutive green bars pattern occurs.
def IsUp = close > open;
plot greenBars = if IsUp[2] and IsUp[1] and IsUp[0] then low else double.nan;
greenBars.SetPaintingStrategy(paintingStrategy.ARROW_UP);
Conclusion
The plot() function is thinkScript is very flexible.
You can declare the plot first and then define its value afterward or vice versa.
To top it off, you can use different colors and styling options to make the plot more visible on your chart.
I took a shot in the dark with the email address since I could not find one on your website. Needless to say it bounced, so thought I’d try this.
I used your vertical line example as a template, but cannot seem to get it to work. My code below… The intent is to post event markers on charts when various markets open, close, lunch break/return
### cfMktMarkers: FOREX Market Markers
# [Attribution: ThinkScript101.com, Melvin]
# Template: AddVerticalLine(secondstilltime(1345)==0, “title”, color.red, curve.firm);
AddVerticalLine(secondstilltime(1800)==0, “Forex open; NZX open”, color.green, curve.short_dash);
AddVerticalLine(secondstilltime(2000)==0, “ASX JPX open”, color.green, curve.short_dash);
AddVerticalLine(secondstilltime(2100)==0, “SGX open”, color.green, curve.short_dash);
AddVerticalLine(secondstilltime(2130)==0, “HKEX SSE open”, color.green, curve.short_dash);
AddVerticalLine(secondstilltime(2400)==0, “NSE open”, color.green, curve.short_dash);
AddVerticalLine(secondstilltime(0045)==0, “NZX close”, color.red, curve.short_dash);
AddVerticalLine(secondstilltime(0200)==1, “ASX JPX close”, color.red, curve.short_dash);
AddVerticalLine(secondstilltime(0200)==2, “DFM open”, color.green, curve.short_dash);
AddVerticalLine(secondstilltime(0300)==0, “STG JSE MOEX FWB SIX LSE open”, color.green, curve.short_dash);
AddVerticalLine(secondstilltime(0400)==1, “SSE close”, color.red, curve.short_dash);
AddVerticalLine(secondstilltime(0400)==0, “HKEX close”, color.red, curve.short_dash);
AddVerticalLine(secondstilltime(0500)==0, “SGX close”, color.red, curve.short_dash);
AddVerticalLine(secondstilltime(0600)==0, “NSE close”, color.red, curve.short_dash);
AddVerticalLine(secondstilltime(0645)==0, “DFM close”, color.red, curve.short_dash);
AddVerticalLine(secondstilltime(2000)==0, “ASX open”, color.green, curve.short_dash);
AddVerticalLine(secondstilltime(0815)==0, “STG close”, color.red, curve.short_dash);
AddVerticalLine(secondstilltime(0900)==0, “B3 open”, color.green, curve.short_dash);
AddVerticalLine(secondstilltime(0930)==0, “USA TSE open”, color.green, curve.short_dash);
AddVerticalLine(secondstilltime(1100)==0, “JSE close”, color.red, curve.short_dash);
AddVerticalLine(secondstilltime(1130)==0, “LSE FWB SIX close”, color.red, curve.short_dash);
AddVerticalLine(secondstilltime(1145)==0, “US Lunch Start;”, color.yellow, curve.short_dash);
AddVerticalLine(secondstilltime(1145)==1, “MOEX close”, color.red, curve.short_dash);
AddVerticalLine(secondstilltime(1345)==0, “US Lunch End”, color.blue, curve.short_dash);
AddVerticalLine(secondstilltime(1600)==0, “USA TSE Bz close”, color.red, curve.short_dash);
AddVerticalLine(secondstilltime(1700)==0, “Forex close”, color.red, curve.short_dash);
Thanks !!!
Hello
I’m trying to understand how to code a script that plot a vertical line every hour but only if time frame is 1M or 5M can you help with this? thank you