In this tutorial, we will learn about the AddChartBubble() function in thinkScript with the help of examples.
AddChartBubble() Overview
The AddChartBubble() function adds a text bubble to the specified location when a defined condition in your script is true.
Syntax of AddChartBubble()
AddChartBubble (time condition, price location, text, color, boolean up);
AddChartBubble() parameters
- Time condition: Specifies the circumstances under which the bubble will appear.
- Price location: Determines the price at which the bubble’s tip is visible.
- Text: Specifies the text that will appear in the bubble.
- Color: Assign a custom color to the bubble.
- Boolean up: Sets the bubble’s display position, either above or below the price location.
Display basic text bubble
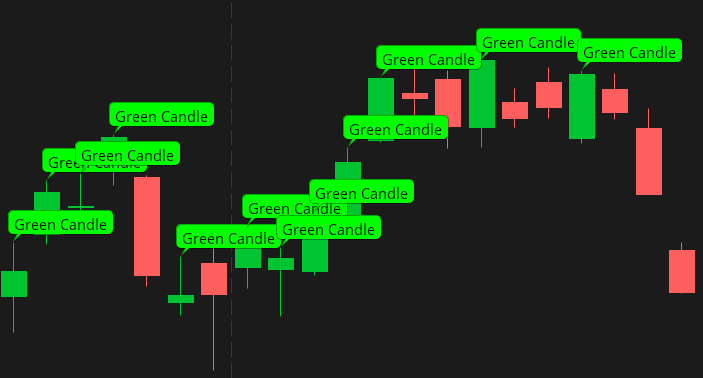
Let’s begin by placing a bubble above each green bar that reads, “Green Candle.”
AddChartBubble(close > open, high, "Green Candle", color.green, yes);
Break text into multiple lines
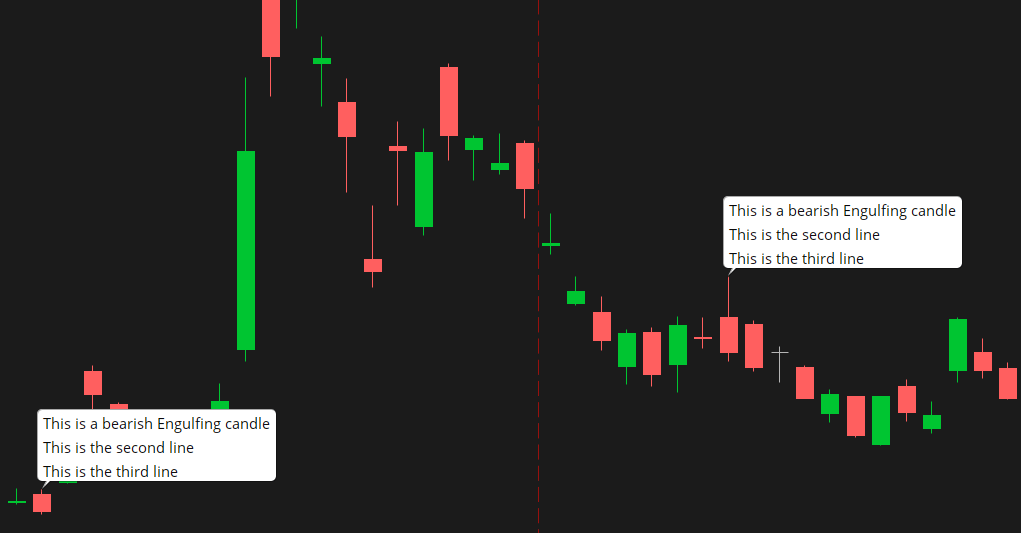
If your bubble contains lots of text, you can break them down into several lines using \n.
# Bearish Engulfing Candles
input length = 20;
input trendSetup = 3;
def BodyMax = Max(open, close);
def BodyMin = Min(open, close);
def IsEngulfing = BodyMax > BodyMax[1] and
    BodyMin < BodyMin[1];
def IsWhite = open < close;
def IsBlack = open > close;
def IsPrevDoji = IsDoji(length)[1];

plot Bearish = IsAscending(close, trendSetup)[1] and
    (IsWhite[1] or IsPrevDoji) and
    IsBlack and
    IsEngulfing;

# Display Engulfing Candles as Chart Bubble
AddChartBubble(Bearish, high, "This is a bearish Engulfing candle\nThis is the second line\nThis is the third line ", color.white, yes);
AddChartBubble at a specific time
Want to display a chart bubble at a specific time using thinkScript?
Sure, Let’s do it!
addchartbubble(secondstilltime(1145)==0, high, "Lunch break", getcolor(2), yes);
In the example above, the AddChartBubble() function fires a text bubble at 11:45 ET.
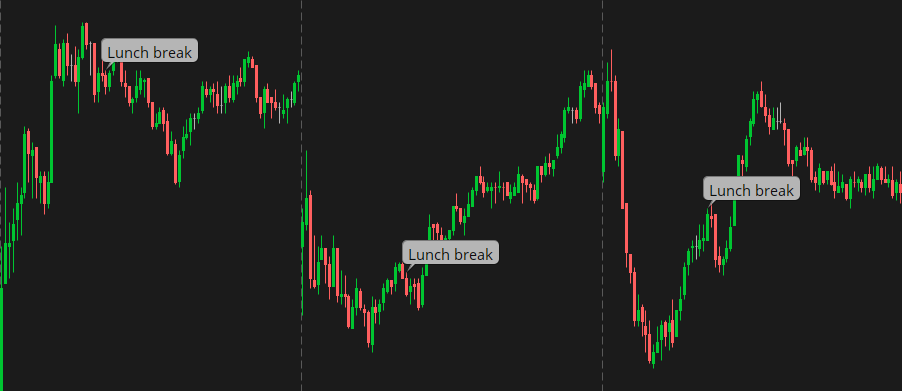
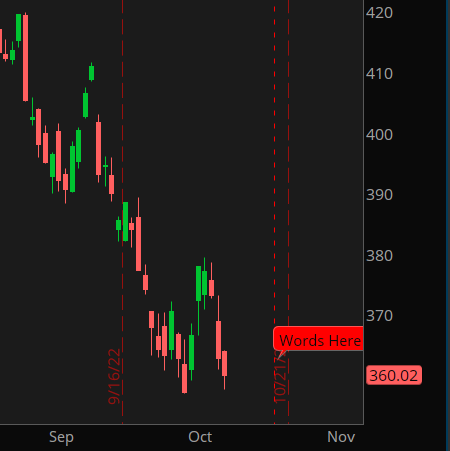
Chart Bubble Future Date and Time
The AddChartBubble() function can also be used to add a text bubble to a given date.
#StudyName: Chart Bubble Future Date and Time
#Description: Plots a chart Bubble  using a user input date and time.
#Author: DMonkey
#Requested By:  Slash
# Ver  1   Date  10.10.2018
# Lounge Notes:
# 11:24 DMonkey: the future bar has no value, so using a dynamic offset to locate bubble location......
# 15:15 DMonkey: Not sure what. Your after slash. What I gave you plots a chart bubble at a user input date  and time in the future as requested. If that bar is in the expansion area it will plot. The axis is the current floating close price. You can add another input and to use a user input if you want to plot at a different price  but logically if the bubble is floating with the current close it makes sense to me.
#inputs
input date = 20181010;
input time = 1100;
#Defs
def c = close;
def bar = BarNumber();
def na = double.nan;
def Lastbar = HighestAll(
              if !IsNaN(c[-1])
              then bar
              else na);
def date2 =  DaysFromDate(date) == 0 ;
def time2 = secondsFromTime(time) == 0;
def a = highestall(
        if  time2 && date2
        then bar
        else na);
def b = if bar == a then getvalue(c, "dynamic offset" = a - lastbar) else na;
#Plot Management
AddVerticalLine(visible = bar == a);
AddChartBubble("time condition" = a, "price location" = b, text = "Words Here");
###   End Code   ###
Stacked Labels
# Stacked Labels Substitute
# Nube
# 10.28.18
#
    # inputs
input location = {default Left, Right};
    # variables
def p = HL2;
def hh = HighestAll(high);
def ll = LowestAll(low);
def mid = (hh + ll) / 2;

def x;
def y;
Switch (location) {
    Case Left:
x = Barnumber() == 1;
y = if   p > mid
    then ll
    else hh;
    Case Right:
x = BarNumber() == HighestAll(BarNumber());
y = hh;
}
    # plots
AddChartBubble(x, y,
" blah, blah, blah,\nnatter, natter.",
Color.Light_Gray, p > mid);
AddChartBubble(x, y,
" blah, blah, blah,\nnatter, natter.",
Color.Light_Gray, p > mid);
Bubble with Date and Price
# BubbleWithDateAndPrice_Nube
# portions of the code from Text and Color code from StanL's treebase
   # inputs
input barsBack = 0;
input price = close;
# throws an error symbol at top left of chart when condition is false. click on the error symbol to view the error message
       # condition  , "text"
assert(barsBack >= 0, "''bars back'' cannot be negative ");
    # variables
def bn = BarNumber();
def month = GetMonth();
def monthDay = GetDayOfMonth(GetYYYYMMDD());
def currentBar = HighestAll(if  !IsNaN(price)
                            then bn
                            else Double.NaN);
# StanL Bubble
                  # X Axis                , Y axis
AddChartBubble(bn == currentBar - barsBack, price,
# This section for text
"Date: " + month + "/" + monthday + (
if    price == close
then  " Close: $"
else  if    price == open
      then  " Open: $"
      else  if    price == low
            then  " Low: $"
            else  if    price == high
                  then  " High: $"
                  else  if    price == OHLC4
                        then  " OHLC4 $"
                        else  if    price == HLC3
                              then  " HLC3 $"
                              else  " Value:  " )+ price,(
# this section for color
if    price == close
then  color.cyan
else  if    price == open
      then  color.pink
      else  if    price == low
            then  color.yellow
            else  if price == high
                  then  Color.White
                  else  if    price == OHLC4
                        then  Color.Dark_Orange
                        else  if    price == HLC3
                              then  Color.Magenta
                              else  color.Plum), yes);

Happy testing!
On an intraday chart, I’d like to have a single AddChartBubble() representing a condition that’s based on the DAILY timeframe. So far all I can seem to accomplish is getting a bubble to show for each hour which is not ideal since there will likely be a different bubble for each day. I recognize this is done somehow in the second part of the AddChartBubble() function but I sure can’t seem to figure it out! Any tips? Thanks!