The previous day’s high, low, and close are essential support and resistance levels that you should display on your ThinkorSwim chart.
Setting up the indicator is easy and only takes a few minutes.
Previous Day High/Low/Close Indicator for ThinkorSwim
# Indicator Name: Previous Day High/Low/Close
# Description: Plot the previous day high, low, and close. Optional settings included to hide individual plot.
# Version: 1.0.0
# Developer: Melvin C.
# URL: https://thinkscript101.com/previous-day-high-low-close-indicator-thinkorswim/

declare hide_on_daily;
input aggregationPeriod = AggregationPeriod.DAY;
input Hplot = yes;
input Lplot = yes;
input Cplot = yes;
plot prevHigh = if Hplot then high(period = aggregationPeriod)[1] else double.nan;
plot prevLow = if Lplot then low(period = aggregationPeriod)[1] else double.nan;
plot prevClose = if Cplot then close(period = aggregationPeriod)[1] else double.nan;
prevHigh.SetPaintingStrategy(paintingStrategy.HORIZONTAL);
prevHigh.SetDefaultColor(GetColor(1));
prevLow.SetPaintingStrategy(paintingStrategy.HORIZONTAL);
prevLow.SetDefaultColor(GetColor(0));
prevClose.SetPaintingStrategy(paintingStrategy.HORIZONTAL);
prevClose.SetDefaultColor(GetColor(9));
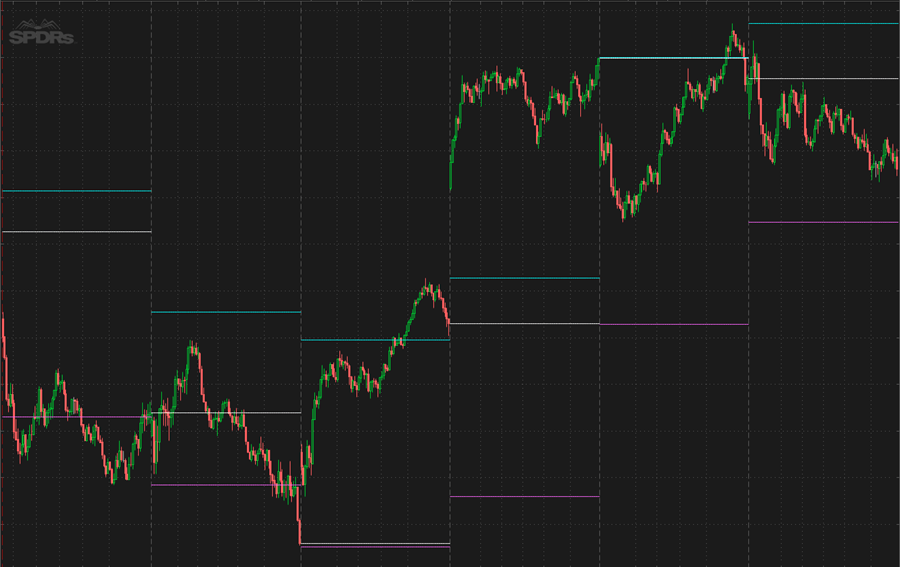
Usage
Once you add the indicator, it automatically plots all three lines on your chart.
- Cyan = previous day’s high.
- Magenta = previous day’s low.
- White = previous day’s close.
If you want to hide/unhide a specific plot, you can do so from the indicator’s settings.
For example, say you only want to display the previous day’s high and low. You can quickly hide the previous day’s close by changing the Cplot setting from Yes to No.
You can also customize the styling of each plot. You can change the color, line style, width, and more.

Understanding the Code
This is a thinkScript code used in the thinkorswim trading platform to create a custom indicator.
The indicator is designed to plot the high, low, and close prices of the previous trading day on the chart.
Here’s an explanation of the code:
Declaration and Inputs:
declare hide_on_daily;: This line indicates that the indicator should be hidden on daily charts. This means it will only be displayed on intraday charts with a different aggregation period.input aggregationPeriod = AggregationPeriod.DAY;: This allows the user to select the aggregation period for the indicator. The default is set to display data for the entire day.input Hplot = yes;,input Lplot = yes;,input Cplot = yes;: These inputs allow the user to choose whether to plot the previous day’s high, low, and close respectively. The default is set to ‘yes’ for all three.
Plotting:
plot prevHigh = if Hplot then high(period = aggregationPeriod)[1] else double.nan;: This line defines the plot for the previous day’s high. It checks ifHplotis set to true, and if so, it retrieves the high price of the previous day using[1](which represents the previous day) and plots it. IfHplotis false, it plotsdouble.nan(a placeholder for “not a number”).plot prevLow = if Lplot then low(period = aggregationPeriod)[1] else double.nan;: Similar to the previous line, this defines the plot for the previous day’s low.plot prevClose = if Cplot then close(period = aggregationPeriod)[1] else double.nan;: This defines the plot for the previous day’s close.
Styling:
prevHigh.SetPaintingStrategy(paintingStrategy.HORIZONTAL);: This line sets the painting strategy for plotting the previous day’s high. In this case, it’s set to a horizontal line.prevHigh.SetDefaultColor(GetColor(1));: This sets the color for the high plot.GetColor(1)retrieves a default color (in this case, it’s the second color in the color palette).- Similar lines set the painting strategy and default colors for the low and close plots.
Happy trading!
Hello Melvin
I am interested in putting yesterdays option volume in my option scan. I have not found the way to do it. Is it possible you can guide me?
Regards
Mike
I don’t think that is possible.
This is awesome! Thank you. Is there anyway to do this for the Thinkorswim app?
It should work on the TOS app. Give it a try and let me know.
Hello Melvin I just came across your site when I googled how to turn a thinkorswim script into pinescript for tradeview. I was wondering if your able to turn thinkorswim scripts into pinescript to fit tradeview? If you could post back or email me that’d be great.
It’s “on” the TOS app. But none of the lines show and prevHigh, prevLow, prevClose all show the same price. If I could send a screen shot, I would.
Thanks