The Average() function in thinkScript calculates the arithmetic mean of two parameters.
In this tutorial, we will learn about the thinkScript Average() function with the help of examples.
average() Syntax
Average (data, length);
average() Parameters
- Data: Provide details about the data that the average is found for.
- Length: Specifies the period for finding the average value.
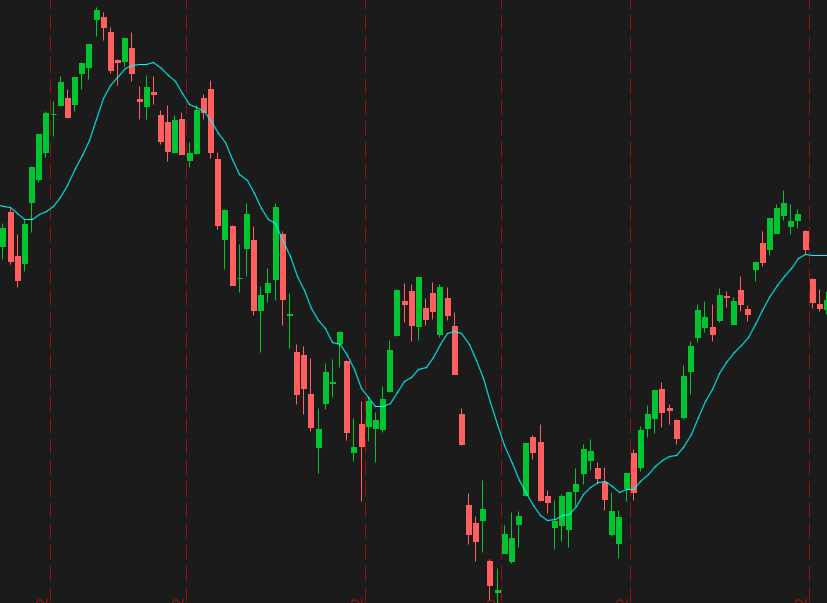
Plot a simple moving average
The average() function is commonly used to calculate moving averages.
For example, here’s a 12-period simple moving average indicator for ThinkorSwim.
input price = close;
input length = 12;
plot SMA = Average(price, length);
The indicator settings allow you to change the price type as well as the length on which the average value is found.
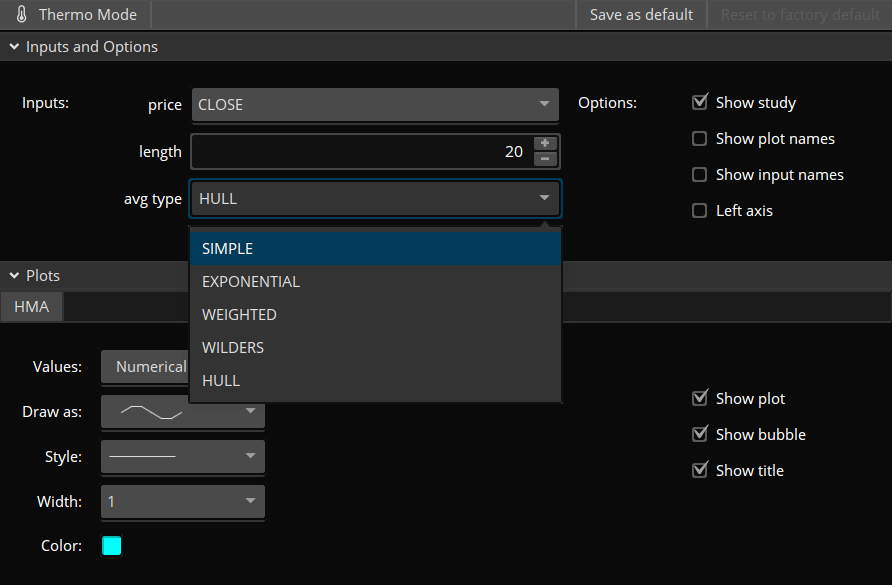
AverageType Switcher
In thinkScript, there are 5 different constants that can be used with the MovingAverage() function.
- EXPONENTIAL
- HULL
- SIMPLE
- WEIGHTED
- WILDERS
You can simply switch between several moving average calculations by using the AverageType switcher.
This method lets you modify the calculation without editing the source code.
input price = close;
input length = 20;
input avgType = AverageType.HULL;
plot HMA = MovingAverage(avgType, price, length);
By default the code above plots the Hull moving average for the last 20 closing prices. However, if you prefer another method, you can go into the indicator settings and select a new option from the dropdown.
Plot Average True Range (ATR)
The Average True Range (ATR) indicator displays the average true price range during a given time period.
declare lower;
input length = 14;
input averageType = AverageType.WILDERS;
plot ATR = MovingAverage(averageType, TrueRange(high, close, low), length);
ATR.SetDefaultColor(GetColor(8));
Plot an average of the past X bars
This code snippet displays an average of the past 5 bars which had a range of more than 10 ticks.
input Threshold = 10;
input n = 10;

def Avg = (fold i = 0 to n
with p
do p + getValue(if close > Threshold then close else 0, i, n - 1)) / n;
addLabel(1, "Avg Value " + Avg, Color.White);
AddLabel(1, "Avg " + (Average(close, n)));
The values are drawn as labels on your chart.