The Anchored VWAP indicator for ThinkorSwim is a simple tool that plots the VWAP (volume-weighted average price) line at a user-defined date/time.
This indicator can be useful for identifying support and resistance levels, or for gauging the average price of a security over a given time period.
Anchored VWAP vs. VWAP
What’s the difference between the Anchored VWAP and the original VWAP?
VWAP starts calculating at the beginning of each trading session. In plain English, every morning at 9:30 ET when the stock market opens.
The VWAP resets itself after every session.
Anchored VWAP, on the other hand, works a bit differently than the VWAP indicator.
Instead of starting the calculation at the beginning of each trading day, the Anchored VWAP will calculate based on a specific date or period defined by the trader.
Anchored VWAP Indicator for ThinkorSwim
#
# Copyright 2022 Scott J. Johnson (https://scottjjohnson.com)
#
# Licensed under the Apache License, Version 2.0 (the "License");
# you may not use this file except in compliance with the License.
# You may obtain a copy of the License at
#
#      http://www.apache.org/licenses/LICENSE-2.0
#
# Unless required by applicable law or agreed to in writing, software
# distributed under the License is distributed on an "AS-IS" BASIS,
# WITHOUT WARRANTIES OR CONDITIONS OF ANY KIND, either express or implied.
# See the License for the specific language governing permissions and
# limitations under the License.
#

#
# AnchoredVWAP
#
# Calculates anchored volume-weighted average price. If used on a chart
# with an aggregation period of Day or higher, the anchor time is ignored
# and the full volume on the first bar is counted.
#

input anchorDate = 20220101;
input anchorTime = 0000;

def todaysDate = GetYYYYMMDD();
def todayIsAnchorDate = if todaysDate == anchorDate then 1 else 0;
def afterAnchorDate = if todaysDate > anchorDate then 1 else 0;
def afterAnchorTime = if SecondsFromTime(anchorTime) >= 0 then 1 else 0;
def afterAnchorDateTime = (todayIsAnchorDate and afterAnchorTime) or afterAnchorDate;

def priceSum = TotalSum(if afterAnchorDateTime then (high + low + close) / 3 * volume else 0);
def volumeSum = TotalSum(if afterAnchorDateTime then volume else 0);

plot anchoredVWAP = priceSum / volumeSum;
anchoredVWAP.SetPaintingStrategy(PaintingStrategy.LINE);
anchoredVWAP.SetDefaultColor(Color.CYAN);
How to Configure the Anchored VWAP Indicator
The Anchored VWAP indicator for ThinkorSwim can be utilized on any timeframe.
It depends on your trading style. I’ve seen people use the Anchored VWAP on the daily chart while others utilize it on intraday charts.
After you import the code to your ThinkorSwim, be sure to configure the following settings:
- Anchor date: Select a date. This should be the point from which you’d like to start your calculation.
- Anchor time: Choose the time from the specific date you’ve selected.
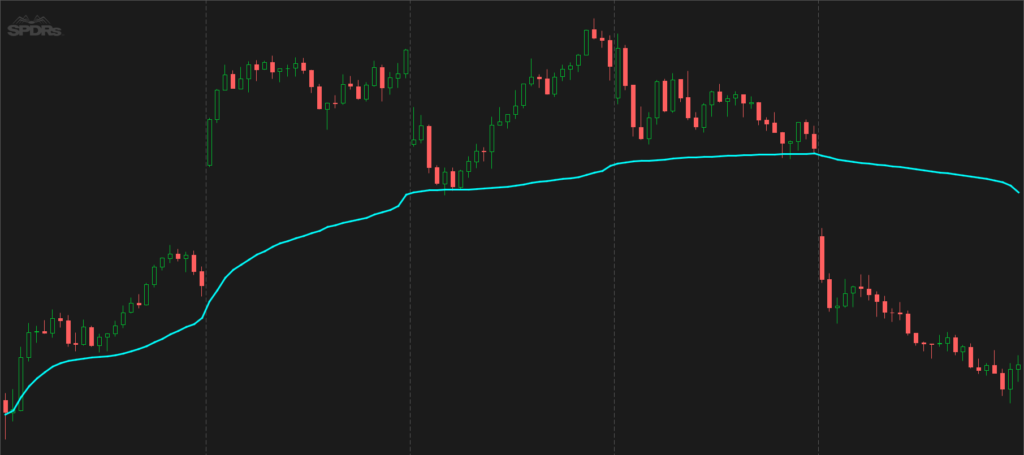
Here’s an example. I selected March 23, 2020, for my Anchored VWAP. This area is significant because it represents the bottom of the COVID-19 stock market crash.

The indicator will then plot the volume-weighted average price starting from this point.

You can customize the color and line style of the Anchored VWAP from that same settings window. By default the line width is set to 3 and the color is Cyan.
I realize that TOS now has Anchored VWAP. It sure is a little cumbersome to use. Does anyone know if a point-and-click style Anchored VWAP is available?
Does anyone have a better version of the VWAP indicator they could share? I tried TOS VWAP, but for the weekly and monthly, it resets every month, and there is no way to change that setting to get an average of a few months or 52 weeks.
That’s because VWAP is a single-day indicator and is restarted at the open of each new trading day. Attempting to create an average VWAP over many days could mean that the average becomes distorted from the actual VWAP reading.
In addition to date and time could you include the option to anchor to the high or low of the candle you are anchoring too?