The Correlation function in thinkScript lets you correlate different stocks against each other.
With a simple indicator, you can get the prices of two different securities and see whether or not they’re correlated.
Correlation Indicator for ThinkorSwim
declare lower;

input length = 10;
input correlationWithSecurity = "SPX";

plot Correlation = correlation(close, close(correlationWithSecurity), length);
Correlation.SetDefaultColor(GetColor(5));
The code above returns the correlation coefficient between the current stock and the SPX.
The standard length parameter is set to 10. This input specifies the time frame on which the correlation is calculated.
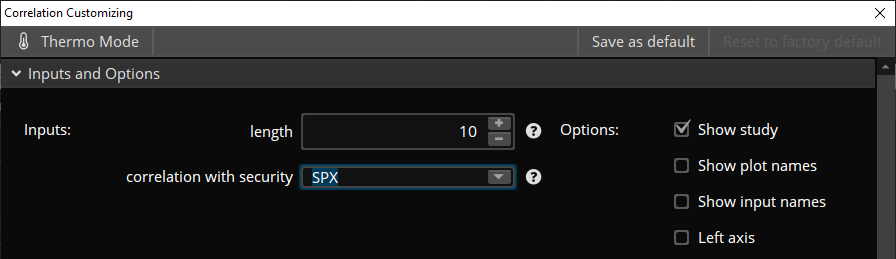
You can change the default ticker (SPX) to any security of your liking. And also the length of the calculation.
- Positive Correlation = The closer the value is to 1, the higher the correlation.
- Negative Correlation = The closer the Correlation Coefficient is to -1, the more they move in opposite directions.
If the plot is greater than 0.9, that indicates a high correlation between the two comparing stocks.
Use Case of Asset Correlation
When a positive correlation occurs (two highly correlated stocks), if one goes up, the other will follow.
In contrast, when we have a negative correlation (two stocks that are not really correlated), we can expect the other to go down if one goes up.
Asset allocation is important.
Here is an example:
The COVID pandemic was bad for Airline stocks. If your portfolio was only invested in Airline companies, it would’ve carried a significant loss.
By picking securities with negative correlation, investors can diversify their portfolio with stocks from sectors such as technology, financial services, and retail to minimize the losses.
Examples of ThinkorSwim Correlation Chart
SPY vs. VIX: Are they correlated?
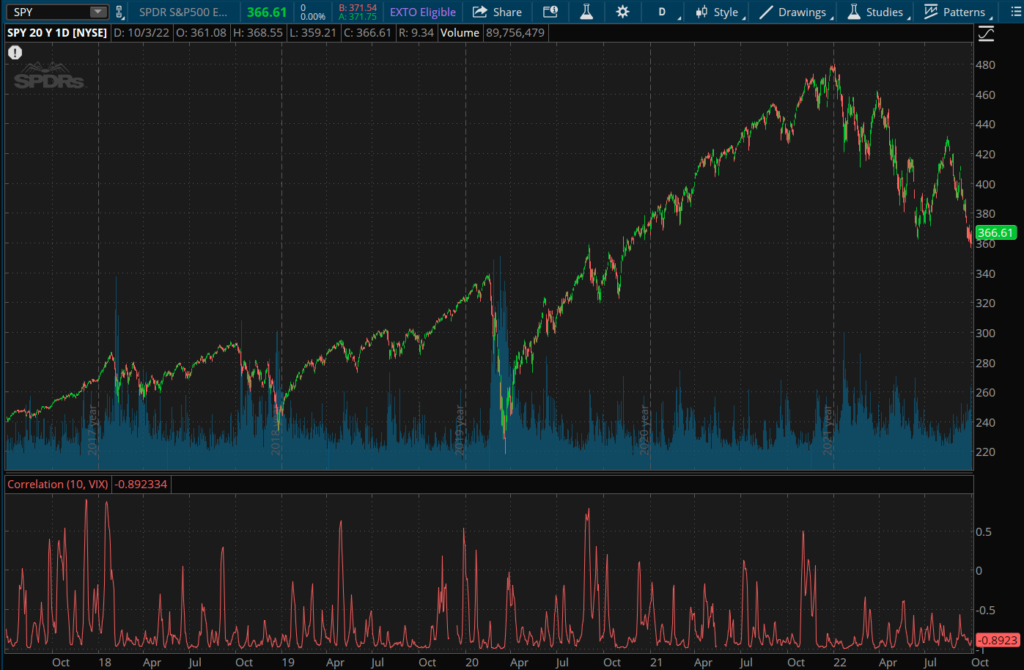
The correlation coefficient (-0.8) between the S&P 500 and VIX (CBOE Volatility Index) suggests a negative correlation. SPY and VIX usually move in opposite directions.
GOOGL vs. MSFT: Are they correlated?
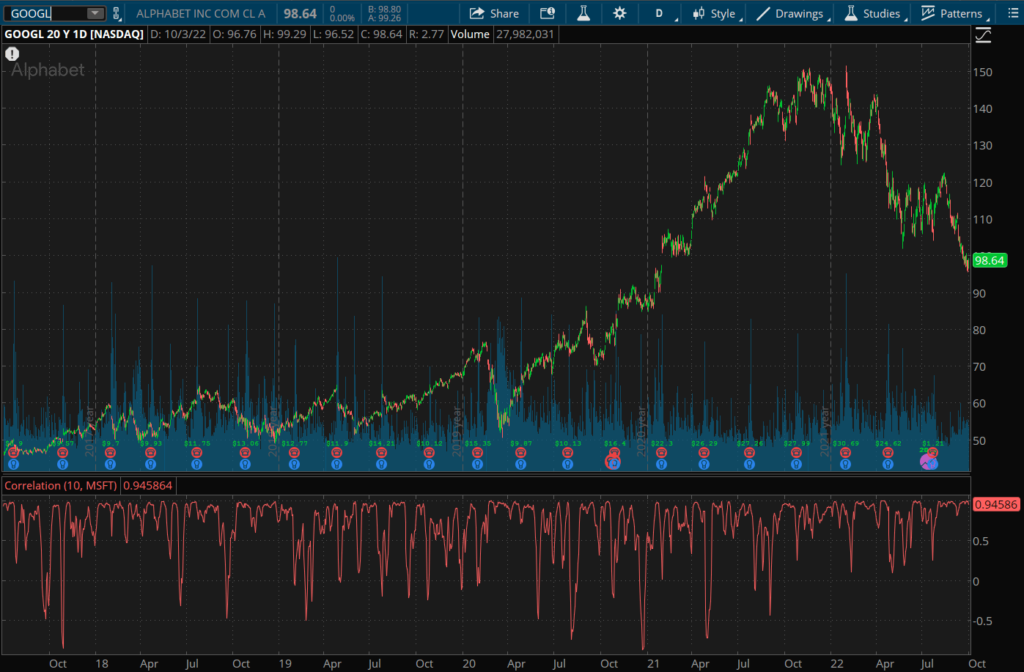
The correlation coefficient for GOOGL and MSFT shows 0.94. This means their stock prices tend to have a strong relationship.
ThinkorSwim’s correlation analysis of stock data can be useful.
It reveals how different stocks movement can sometimes influence the other. Perhaps in the same direction or even opposite.