The AddCloud function in thinkScript is used to add a semitransparent cloud on your ThinkorSwim chart.
The cloud is plotted by connecting the highest value and the lowest value of two data points.
This function is useful for highlighting important areas or information on the chart.
In this guide, we will learn about the thinkScript AddCloud function with the help of examples.
AddCloud Syntax and Parameters
The syntax for the AddCloud function is:
AddCloud (data1, data2, custom_color1, custom_color2, showBorder);You can assign two different colors to your cloud, depending on how data1 and data2 is compared. If there is no particular comparison or there isn’t a need for two colors in one cloud, then you can assign a single color to AddCloud.
Border can be given to the AddCloud function. However, the border is invisible by default if it is not expressly assigned.
thinkScript AddCloud Examples
Let’s start with the first example.
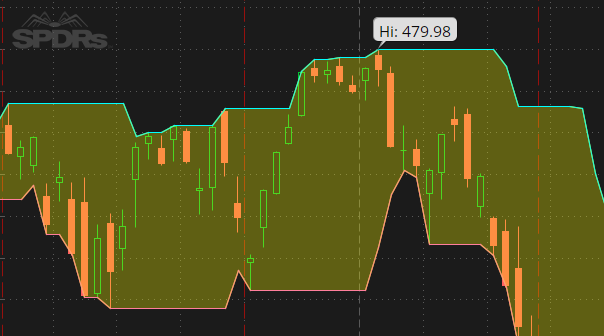
HH-LL Cloud
In the following example, we plot the highest high and lowest low of the last 10 bars. The cloud is plotted between the highest value and the lowest value.
input length = 10;
plot highest_high = Highest(high, length);
plot lowest_low = Lowest(low, length);
AddCloud(highest_high, lowest_low, color.yellow, color.yellow, yes);
SMA Crossover Cloud
The script below draws a cloud between the 50-period simple moving average and the 200-period simple moving average.
In addition, you may notice that the cloud has two colors: red and green.
As mentioned earlier, the AddCloud function can have two different colors depending on how we compare our data.
input price = close;
input fastLength = 50;
input slowLength = 200;
input averageType = AverageType.SIMPLE;
plot FastMA = MovingAverage(averageType, price, fastLength);
plot SlowMA = MovingAverage(averageType, price, slowLength);
AddCloud(FastMA, SlowMA, Color.Green, Color.Red);
A green cloud represents a bullish trend where the 50 SMA is above the 200 SMA. Conversely, the red cloud illustrates a bearish trend where the 50 SMA is below the 200 SMA.
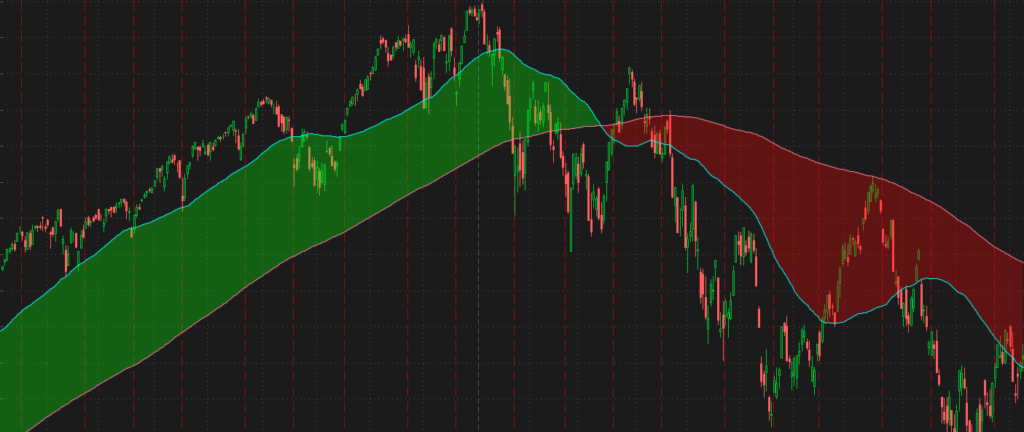
Until there is a change in trend (crossover), the color of the cloud remains as is.
ROC Oscillator Cloud
The AddCloud function can also work with lower studies in ThinkorSwim. These indicators usually create an oscillator on your chart.
The script below displays the Rate of Change indicator. I added the AddCloud function to show the current trend.
declare lower;
input length = 14;
input colorNormLength = 14;
input price = close;
assert(length > 0, "'length' must be positive: " + length);
plot ROC = if price[length] != 0 then (price / price[length] - 1) * 100 else 0;
plot ZeroLine = 0;
AddCloud(ROC, ZeroLine, Color.Green, Color.Red);
A green cloud is shown when the Rate of Change (ROC) is greater than 0. This demonstrates that the stock is currently in an uptrend. The red cloud denotes a downtrend when the ROC value is less than 0.

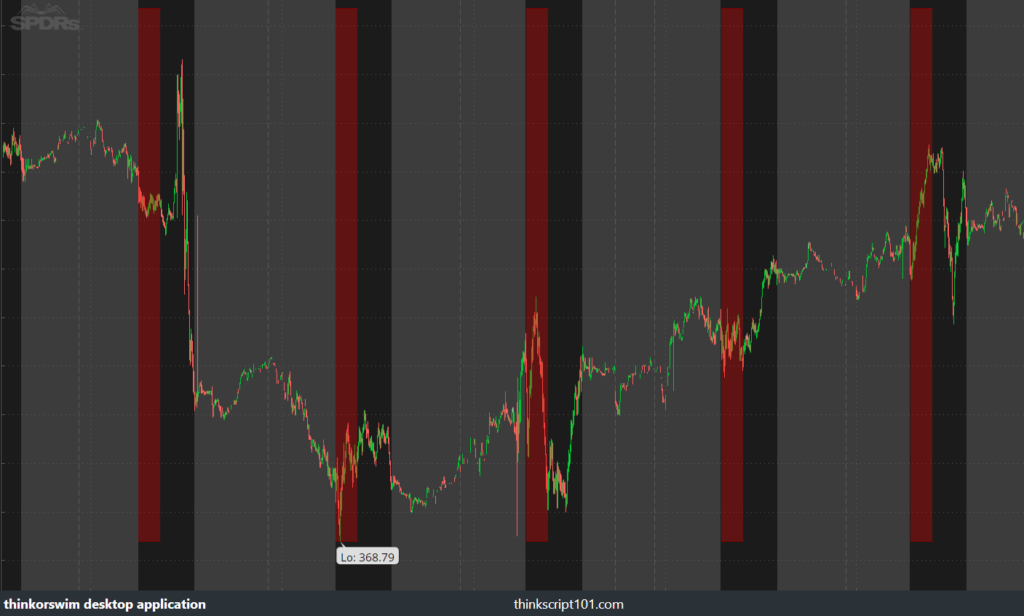
AddCloud at a Specified Time
Here is a script that lets you plot a box (cloud) between two specified time of day in ThinkorSwim.
# TS_TRADEZONES
# http://www.thinkscripter.com
# [email protected]
# Last Update 30 JUN 2009

input zoneStart = 1500;
input zoneEnd = 1615;
input type = {default NOTRADE, REVERSAL};
plot highBar;
plot lowBar;

switch (type){

case NOTRADE:
highBar = if secondsTillTime(zoneStart) <= 0 and secondsTillTime(zoneEnd) >= 0 then highestAll(high) else double.nan;
lowBar = if secondsTillTime(zoneStart) <= 0 and secondsTillTime(zoneEnd) >= 0 then lowestAll(low) else double.nan;

case REVERSAL:
lowBar = if secondsTillTime(zoneStart) <= 0 and secondsTillTime(zoneEnd) >= 0 then highestAll(high) else double.nan;
highBar = if secondsTillTime(zoneStart) <= 0 and secondsTillTime(zoneEnd) >= 0 then lowestAll(low) else double.nan;
}
highBar.assignValueColor(if highBar>lowBar then color.dark_red else color.green);
lowBar.assignValueColor(if highBar>lowBar then color.dark_red else color.green);
addCloud(lowBar, highBar);
#---------------- End Of Code --------------------
Happy testing!
Hey Melvin,
I’ve noticed some strange behavior with the AddCloud function that I’ve never seen documented and was wondering if you have some insight with this.
Part of the indicator that I’m writing includes a background via AddCloud that colors itself based on the strength of the trend.
What I’ve noticed is that when the trend changes (most commonly from the MACD diff flipping +/-), AddCloud leaves a gap between the previous cloud and the new cloud. Why is that? What’s the best way to fill the gap?
This is what it looks like:
https://imgur.com/Lr4J5En
If you look closely, the gap is actually BETWEEN one candle and the next – it doesn’t fill the space between periods, which is bizarre to me (and it doesn’t seem to behave this way when used between, say, two moving averages for example).
Also, I’ve seen some instances where AddCloud creates this “X” shape when transitioning from one cloud to the next, but I haven’t been able to replicate it myself. This example is from Simpler Trading’s “Ready Fire Aim” indicator:
https://imgur.com/S39B8dk
If you have any light you can shed on either of these occurrences I’d very much appreciate it.