The EntryPrice() function in thinkScript gives you the price of your entry order. If you have multiple entries in the same direction, the function returns the average price for all of them.
The function is frequently used in combination with TOS’ backtesting strategy for order entry and stop loss. Furthermore, EntryPrice() helps to calculate the theoretical P/L from a trade.
Here are some examples of the EntryPrice() function in thinkScript.
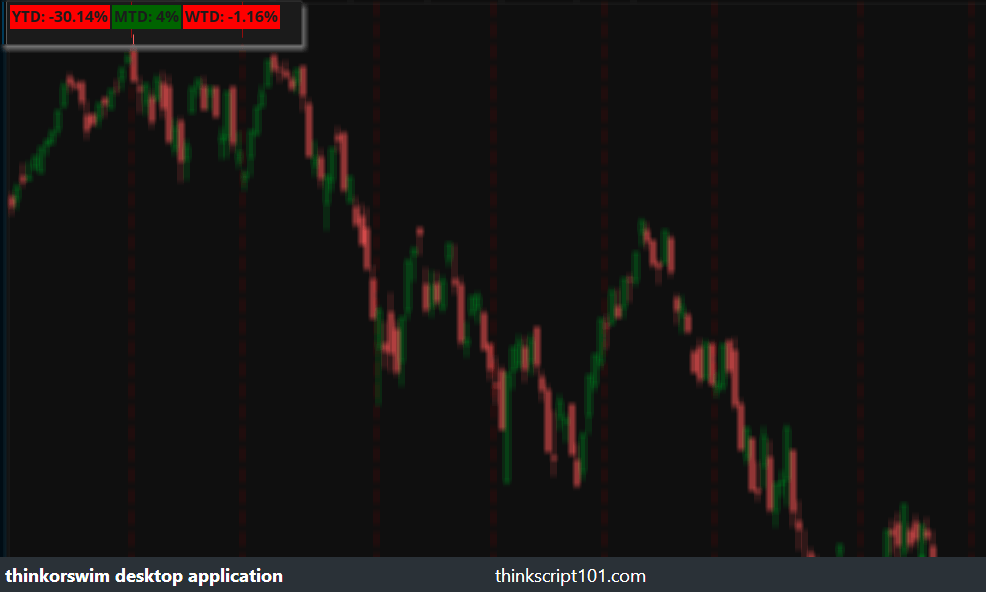
Example 1: Display YTD Return
The script below employs the EntryPrice() function to show the Year to Date (YTD) percentage change on your chart. In addition, there are also labels for Month to Date (MTD) and Week to Date (WTD) returns.
# Unknown author
# October 31, 2018
# thinkScript OneNote
input price = close;
input show_label = yes;
def entryprice = price;
####################
# Percent_Change_Year_To_Date
def YearClose = if GetYear() != GetYear()[1] then close[1] else yearclose[1];
def YTDnetchange = ((entryprice - YearClose) / YearClose) ;
plot YearValue = YTDnetchange;
YearValue.Hide();
AddLabel(show_label, "YTD: " + AsPercent(YearValue), if YearValue > 0 then Color.Dark_GREEN else Color.RED);
####################
# Percent_Change_Month_To_Date
def MonthClose = if GetLastMonth() == GetMonth() then close(GetSymbol(), period = AggregationPeriod.MONTH)[1] else Double.NaN;
def MTDnetchange = ((entryprice - MonthClose) / MonthClose) ;
plot MonthValue = MTDnetchange;
MonthValue.Hide();
AddLabel(show_label, "MTD: " + AsPercent(MonthValue), if MonthValue > 0 then Color.DarK_GREEN else Color.RED);
####################
# Percent_Change_Week_To_Date
def WeekClose = if GetLastWeek() == GetWeek() then close(GetSymbol(), period = AggregationPeriod.WEEK)[1] else Double.NaN;
def WTDnetchange = ((entryprice - WeekClose) / WeekClose) ;
plot WeekValue = WTDnetchange;
WeekValue.Hide();
AddLabel(show_label, "WTD: " + AsPercent(WeekValue), if WeekValue > 0 then Color.DARK_GREEN else Color.RED);
EntryPrice() in Backtesting Strategy
The nice thing about EntryPrice() is that you can use it in your backtesting script. The user can specify their desired profit point or stop loss level from the entry price, and the script automatically executes a sell order.
AddOrder(OrderType.SELL_TO_CLOSE, close > EntryPrice() + 15 or close < EntryPrice() - 10);
The thinkScript EntryPrice function is utilized in the script above to close a long position when the price is either greater than the entry price by 15 (to realize profit) or less than 10 to minimize losses.
Here’s another example:
To determine if your ThinkorSwim backtesting strategy is already in a trade, you can use the script below.
def Entry = if isNaN(EntryPrice()) then Entry[1] else EntryPrice();
plot status = if Entry != Entry[1] then low else double.nan;
status.SetStyle(Curve.FIRM);
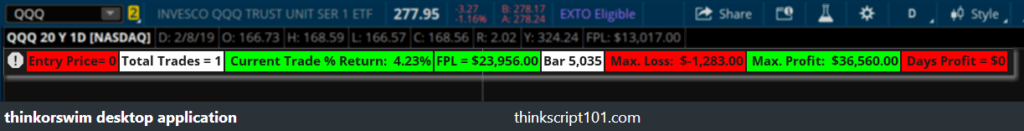
FPL Dash Board Additions
The FPL Dash Board script can be inserted into any of your existing backtesting strategies to display additional information about your current max loss, max profit, total trades, and trade percentage return.
## FPL Dash Board Additions
# Mobius
input showBarNumbers = no;
input begin = 0000;

# Only parses on a Strategy Chart
def entryPrice = if isNaN(EntryPrice())
                 then entryPrice[1]
                 else EntryPrice();
def entryCount = CompoundValue(1, if !isNaN(EntryPrice) and
                 EntryPrice != EntryPrice[1]
                 then entryCount[1] + 1
                 else entryCount[1], 1);
AddLabel(1, "Entry Price= " + highestAll(entryPrice));
AddLabel(1, "Total Trades = " + entryCount, Color.White);
def Active = if SecondsTillTime(begin) == 0 and
                SecondsFromTime(begin) == 0
             then 1
             else 0;
  def FPL = FPL();
  def ZeroLine = if IsNaN(close) then Double.NaN else 0;
  def highFPL = HighestAll(fpl);
  def LowFPL = LowestALL(fpl);
  def bn = barNumber();
  def fplreturn = (fpl - fpl[1])/fpl[1];
  def cumsum = sum(fplreturn);
  AddLabel(1, " Current Trade % Return:  " + AsPercent(cumsum), if cumsum > 0
                                                     then Color.GREEN
                                                     else Color.RED);
def highBarNumber = CompoundValue(1, if fpl == highFPL
                                     then bn
                                     else highBarNumber[1], 0);
def lowBarNumber = CompoundValue(1, if fpl == lowFPL
                                    then bn
                                    else lowBarNumber[1], 0);
def Maxloss = if bn == lowBarNumber then FPL else Double.Nan;

  AddLabel(1, "FPL = " + AsDollars(FPL), if FPL > 0 then color.green else color.red);
  AddLabel(1, "Bar " + bn, Color.White);
  AddLabel(1, " Max. Loss" + (if showBarNumbers
                              then " at bar " + lowBarNumber
                              else "") + ":  " + AsDollars(lowFPL), Color.RED);
  AddLabel(1, " Max. Profit" + (if showBarNumbers
                                then " at bar " + highBarNumber
                                else "") + ":  " + AsDollars(highFPL), Color.GREEN);
def Midnight = if Active then FPL else Midnight[1];
def DaysProfit = FPL - Midnight;
addLabel(1, " Days Profit = $" + DaysProfit, if DaysProfit > 0
                                             then Color.Green
                                             else Color.Red);
# End Code
Happy testing!