The Fed Net Liquidity indicator is a concept discovered by Max Anderson to calculate the fair value of SPX (S&P 500 Index).
The formula he shared on Twitter consists of the Fed Balance Sheet, TGA (Treasury General Account), and Reverse Repo.
Net Liquidity = Fed Balance Sheet - (TGA + Reverse Repo)
The data for each component above is accessible on the FRED website.
- Fed Balance Sheet https://fred.stlouisfed.org/series/WALCL
- Treasury General Account (TGA) https://fred.stlouisfed.org/series/WTREGEN
- Reverse Repo https://fred.stlouisfed.org/series/RRPONTSYD
Alternatively, you can use the script below (written by a thinkScript OneNote contributor) to show the Net Liquidity indicator in ThinkorSwim.
This indicator can be used to go long and short the market, precisely the S&P 500 index.
Fed Net Liquidity Indicator for ThinkorSwim
# amalia
# 10/03/2022
# thinkScript OneNote
declare lower;
def a = If(IsNaN(Close("WALCL:FRED")), a[1], Close("WALCL:FRED"));
def b = If(IsNaN(Close("WTREGEN:FRED")), b[1], Close("WTREGEN:FRED"));
def c = If(IsNaN(Close("RRPONTSYD:FRED")), c[1], Close("RRPONTSYD:FRED"));
def SPX = If(IsNaN(Close("SPX")), SPX[1], Close("SPX"));
def SPXFairValueNetLiq = (A - (b + c)*1000)/1000/1.1-1625;
def SPXFairValue = If(!IsNaN(Close), SPXFairValueNetLiq, Double.NaN);
# Melvin C.
# added on 10/19/2022
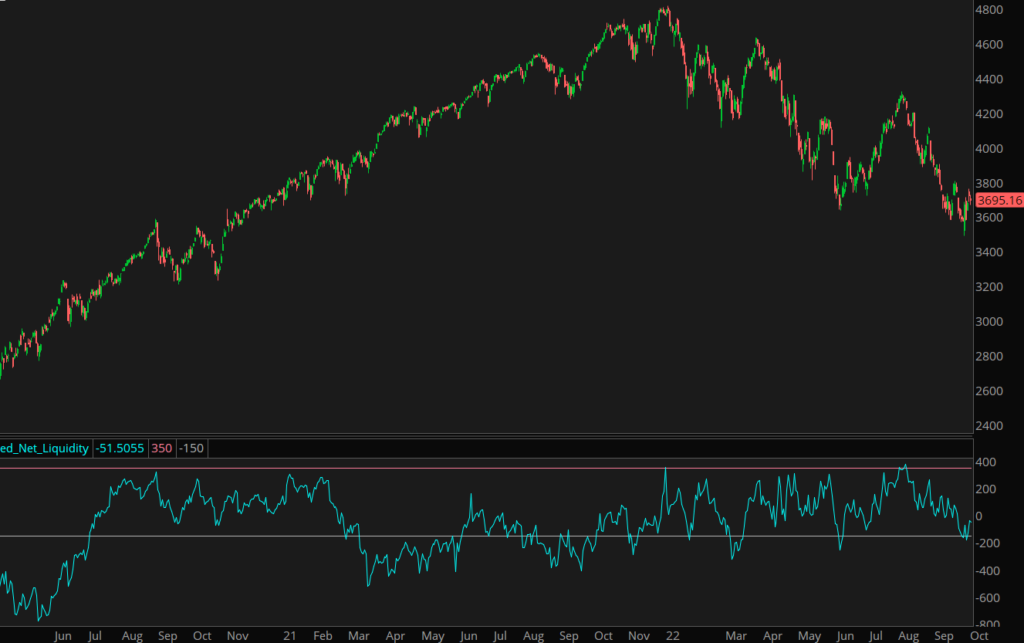
plot difference = close - SPXFairValue;
plot overbought = 350;
plot oversold = -150;
How To Use the Fed Net Liquidity Indicator
This year so far, the Net Liquidity indicator has presented three perfect short entries on the SPX.
- Jan 3
- Apr 20
- Aug 15

According to Max Anderson, the Fed Net Liquidity indicator has just two trading rules.
- Short when the reading is above 350
- Long when the reading is below -150

Take a look at the video below to learn more about the indicator.
Sources: @maxjanderson on Twitter
The three data sources are in different frequence, say weekly or daily. I do not see, in the thinkscript, this is hadled properly.
Some data is only released monthly so monthly, but the Daily and Weekly just shows minor offsets. Took me while to figure out this only works on SPX and the chart has to be on SPX and on the DAILY WEEKLY or MONTHLY
Why did we subtract 1625 in line #9; and why did we divided by 1.1?
Line #9: there is a division by 1.1 and a subtraction of 1625. Why / rationale?
Thank you for sharing. Great indicator for the toolbox. Here is a tos link for folks who are not familiar with thinkscript yet:
http://tos.mx/MpJOPqQ