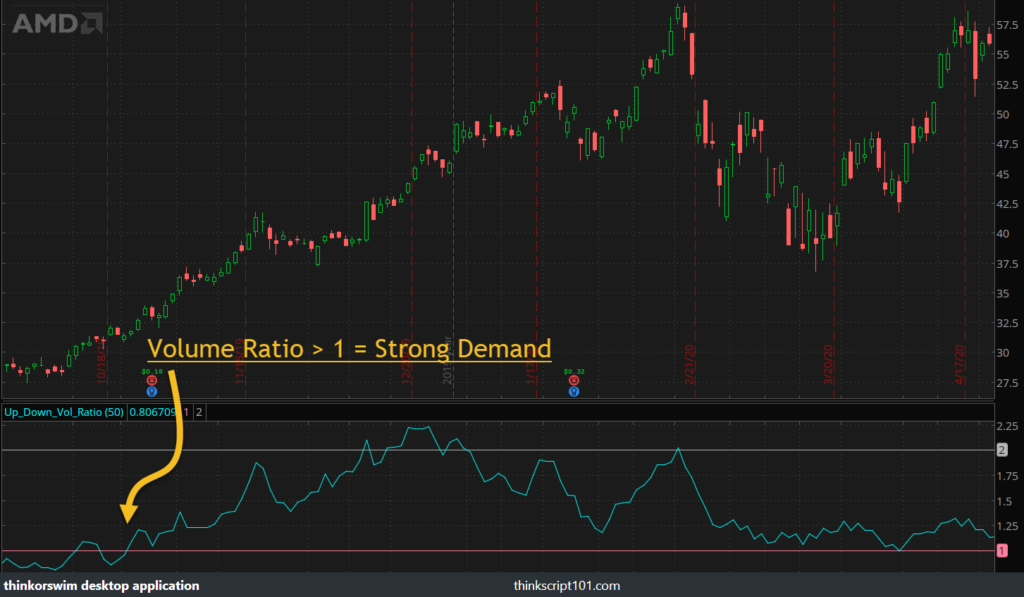
The Up/Down Volume Ratio for ThinkorSwim sheds light on the stock’s buying and selling pressure based on its volume.
This helps you determine whether there has been a change in market sentiment for a particular stock.
The idea originally came from Investors.com. The formula is as follows:
A 50-day ratio that is derived by dividing total volume on up days by the total volume on down days. A ratio greater than 1.0 implies positive demand for a stock.
Investors and traders can use the indicator to find stocks under accumulation.

Up/Down Volume Ratio for ThinkorSwim
#Indicator Name: Up/Down Volume Ratio
#Version: 1.0.0
#Developer: Melvin C.
#URL: https://thinkscript101.com/up-down-volume-ratio-indicator-thinkorswim/
declare lower;
input length = 50;
def upVolume = if close > close[1] then volume else 0;
def downVolume = if close < close[1] then volume else 0;
def totalUp = Sum(upVolume, length);
def totalDown = Sum(downVolume, length);
def VolumeRatio = totalUp / totalDown;
plot data = VolumeRatio;
plot level_1 = 1;
plot level_2 = 2;
How to Use
When volume is increasing and there are signs of institutional buying, that’s a good time to trade.
Large orders placed in the market by institutional investors like hedge funds and mutual funds frequently have a substantial impact on volume and price when they are executed.
The Up/Down Volume Ratio aids in finding stocks with strong buying demand.
Import the source code above and add it to your ThinkorSwim chart.
- Volume ratio below 1 = selling pressure
- Volume ratio above 1 = buying pressure
- Volume ratio above 2 = significant buying pressure

This indicator is insufficient on its own. Use it in addition to technical analysis and fundamental analysis.
Hey, Thanks for the script. When I use this script, the study scale (y-axis) is using the ticker’s scale i.e., if the ticker is SPY it is using 400 ~ 500 as y-axis. Any pointers on how to fix it? Thanks.
Also there is no Up/Down Ration default in TOS!