The TicTocTock indicator for ThinkorSwim is based on the idea that if the top 5 companies in the S&P 500 Index are not moving together “in a meaningful way,” then the market is more difficult to trade.
This indicator can help you identify whether the market is trending or moving sideways. When there is little correlation, you should refrain from entering a trade.
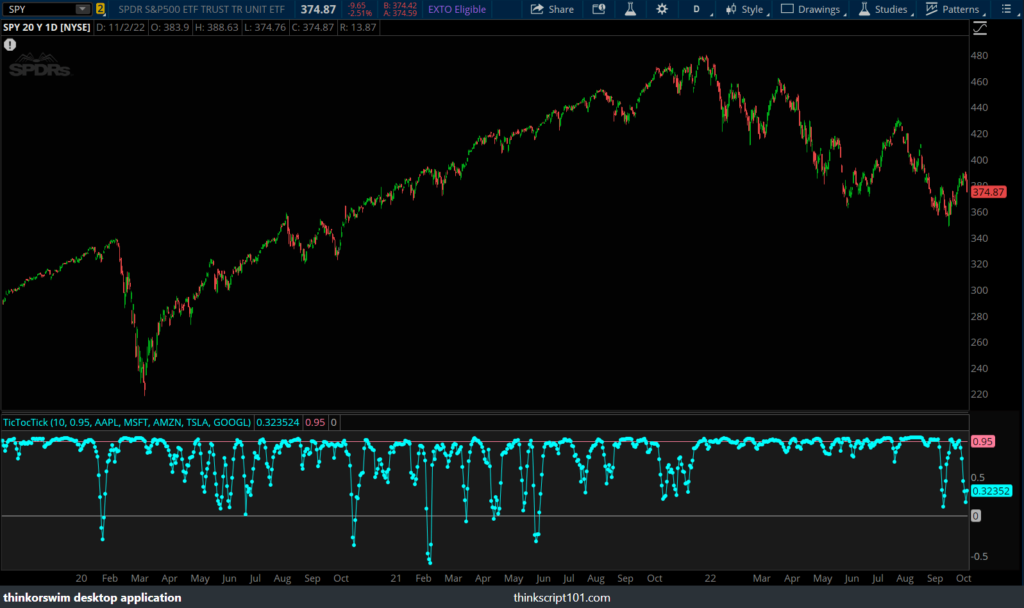
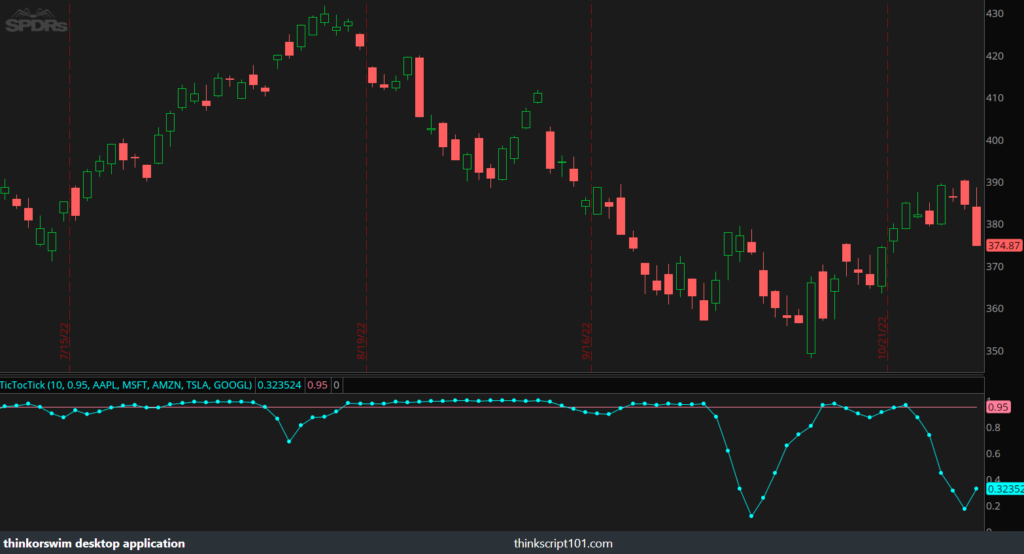
TicTocTick Market Indicator for ThinkorSwim
#Name: TicTocTick Indicator
#Version: 1.0.0
#Developer: Melvin C.
#URL: https://thinkscript101.com/tictoctick-market-indicator-thinkorswim/
declare lower;
input length = 10;
input threshold = 0.95;
input correlationWithSecurity1 = "AAPL";
input correlationWithSecurity2 = "MSFT";
input correlationWithSecurity3 = "AMZN";
input correlationWithSecurity4 = "TSLA";
input correlationWithSecurity5 = "GOOGL";
def top1 = close(correlationWithSecurity1);
def top2 = close(correlationWithSecurity2);
def top3 = close(correlationWithSecurity3);
def top4 = close(correlationWithSecurity4);
def top5 = close(correlationWithSecurity5);
def combo = (top1 + top2 + top3 + top4 + top5) / 5;
plot Correlation = correlation(close, combo, length);
Correlation.SetPaintingStrategy(PaintingStrategy.LINE_VS_POINTS);
plot filter = threshold;
plot zero = 0;
I utilized the Correlation Coefficient function to put this indicator together.
The following are the top 5 largest companies on the S&P 500 index (by weight):
- Apple (AAPL)
- Microsoft (MSFT)
- Amazon (AMZN)
- Tesla (TSLA)
- Alphabet Class A (GOOGL)
I added them to the script above.
How to Use
The TicTocTock indicator fluctuates on a scale of 1 to -1. The correlation line is plotted in cyan color.
The script measures the correlation between SPY (S&P 500 Index) and its top 5 companies.
The closer the reading is to 1, the higher their positive correlation. On the other hand, the more they move in the opposite direction, the closer the correlation line is to -1.
Add the indicator to ThinkorSwim and view it with your SPY chart.
Ideally, when you’re day trading or scalping the SPY, you want to see the correlation line above 0.95. This means the top 5 stocks in the S&P 500 are moving together.
Disclosure: This script was made based on a single tweet shared on Twitter. I’m not sure whether it’s accurate because I don’t have a paid subscription to TicTocTick’s Substack Newsletter.
It may not be precisely the same, but I believe the indicator can still be useful to SPY/SPX traders. Give it a try!

Happy testing.